Back Spread Strategy as a Proxy for Black Swan Event Benefits
When we are creating the strategy, traders look at what has happened in the past. Sometimes they go for trend-following strategies and may deploy various indicators, such as moving averages or techniques like Dow theory, to determine the direction. Also, traders who like to pursue mean-reversion may opt for option-writing strategies to take advantage of theta decay.
However, in both cases, the trader looks to the past to gauge what may happen in the future. But only a few sophisticated traders build Strategies for what is unlikely to happen. The back spread strategy is actually this kind of strategy, which is based on Black Swan events
Also check: Scalper Mode on 915 | Straddle Chart
What Is a Back Spread?
Let us first define what a Black Swan event is. A Black Swan event is highly unlikely; however, if it occurs, it can lead to significant movements or losses. It is interesting to note that black-on-black events actually occur quite frequently, especially in the stock market. This is because the stock market has high Kurtosis, leading to more-than-expected Black Swan events.
Now, let us define a backspread strategy. Back spread is an option strategy in which the trader sells more options at one Strike price. And buys more lots at another strike.
The most common versions are:
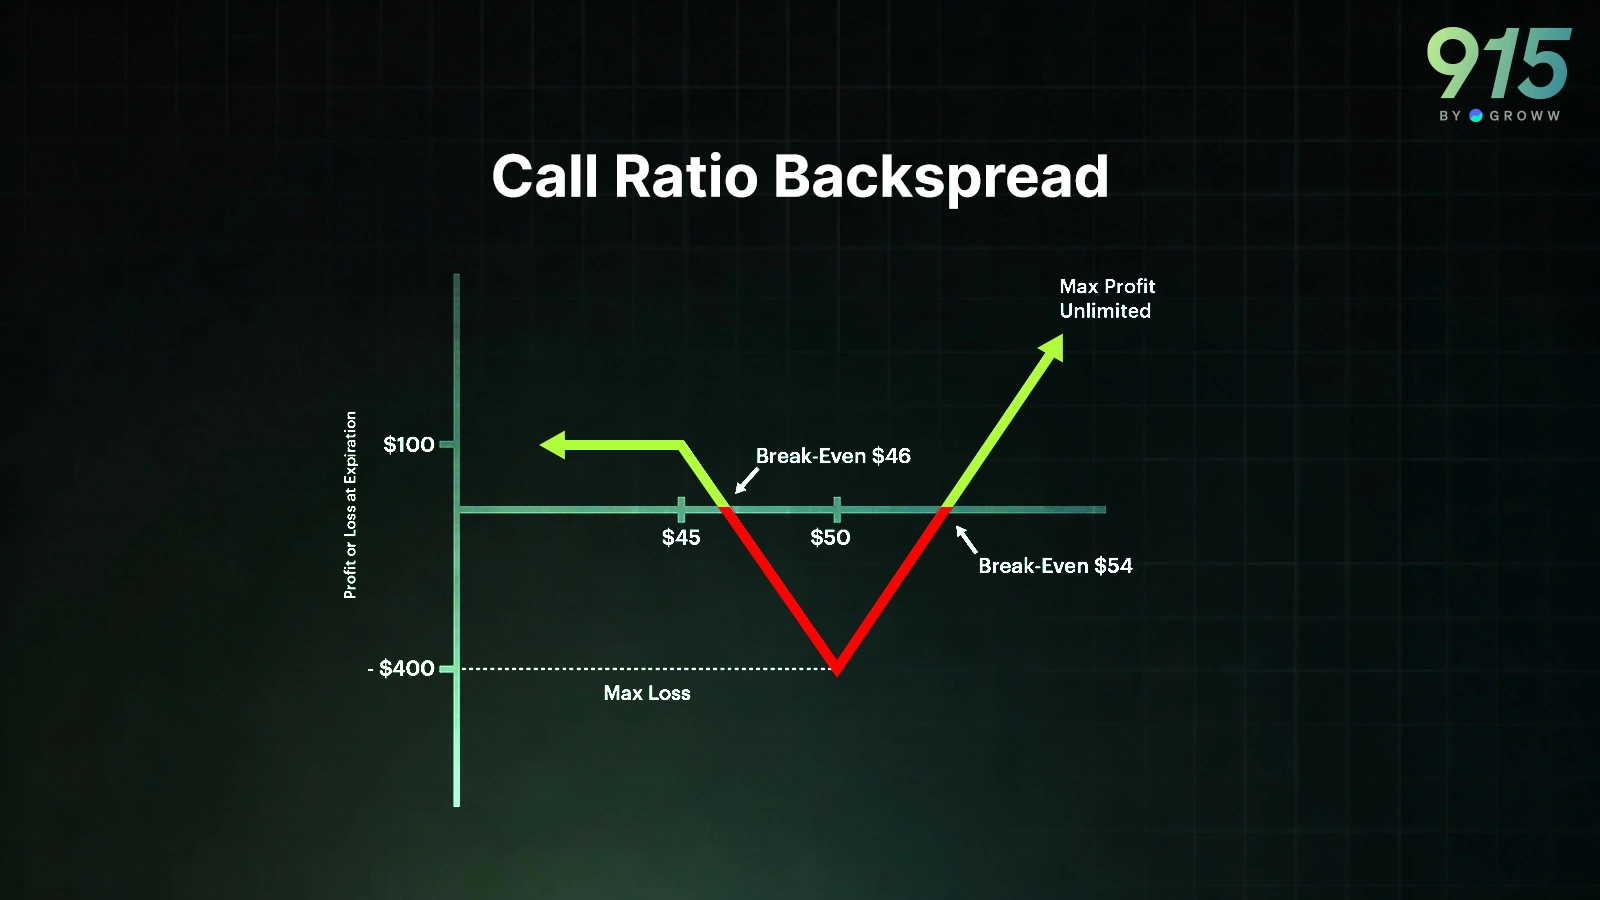
- Call ratio back spread (bullish volatility expansion)
- Put ratio back spread (bearish volatility expansion)
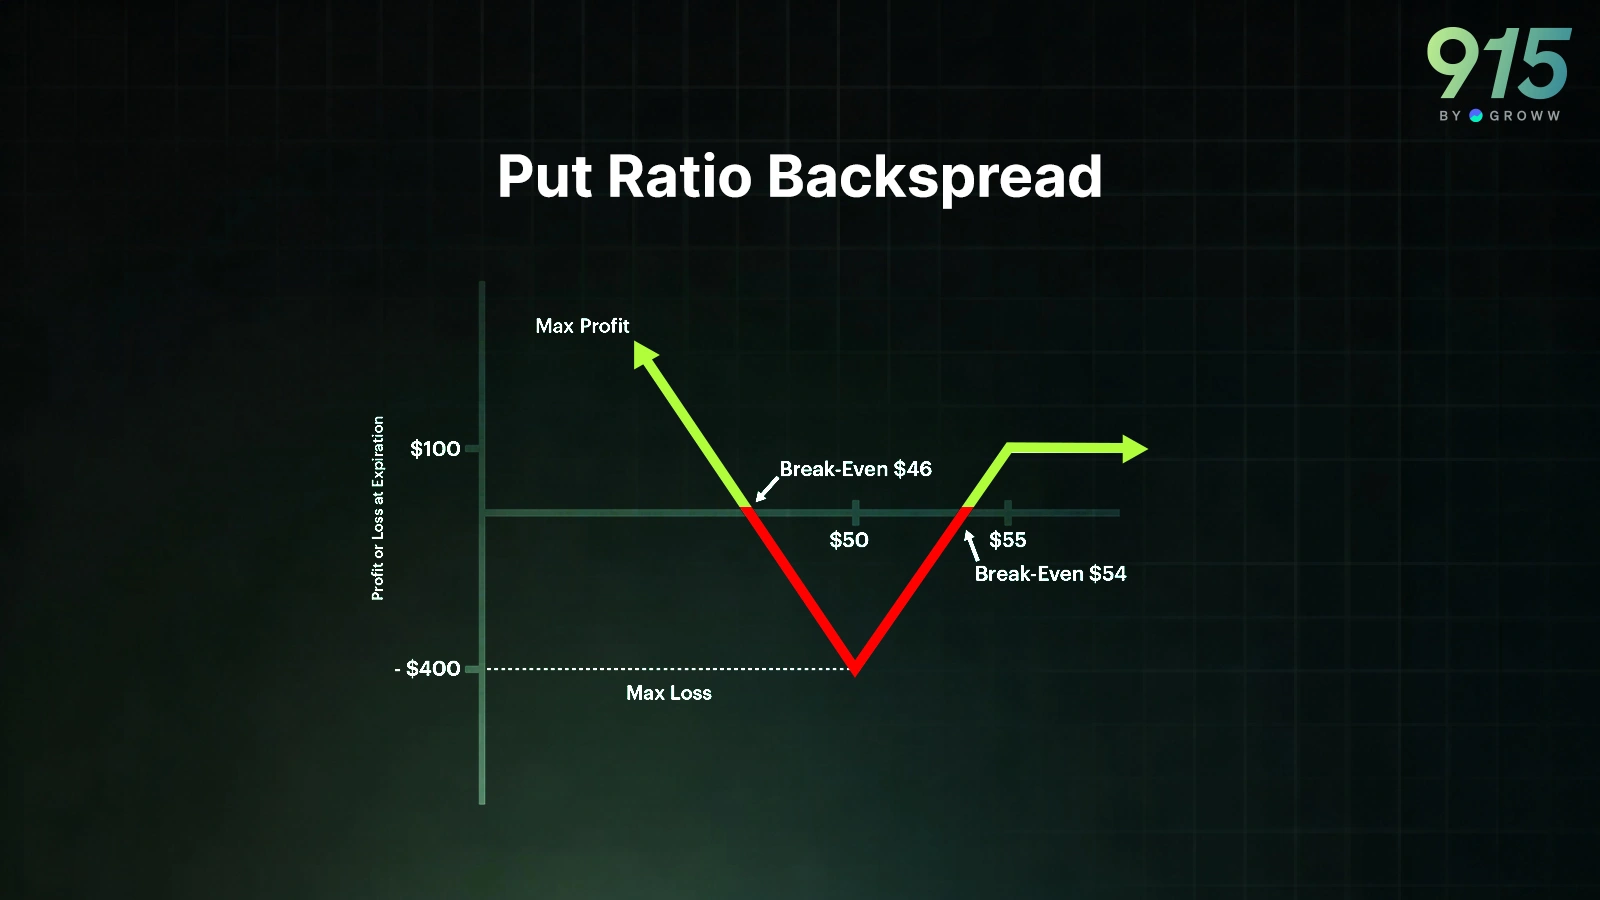
Let us take the example of the put ratio backspread strategy. Let us assume that the stock is trading at ₹100, and the expiry we are going to trade is the same-month expiry. Now, the strategy is just to short one lot of 100 put options. And we are going to buy two lots of 90 put options. Here is the initiation
|
Leg |
Strike |
Action |
Premium (₹) |
Cash Flow |
|
Put |
100 |
Sell 1 |
6 |
+6 |
|
Put |
90 |
Buy 2 |
2 each |
-4 |
|
Net |
+2 Credit |
The strategy gives us a net credit of ₹2. Hence, this reduces the cost of tail exposure.
Now, let us see different scenarios at expiry.
Case 1: The stock has gone up to ₹105
|
Component |
Value |
|
100 Put |
0 |
|
2 × 90 Puts |
0 |
|
Net Option Payoff |
0 |
|
Initial Credit |
+2 |
|
Total Profit |
+2 |
Case 2: The stock has reduced to ₹95
|
Component |
Value |
|
100 Put |
5 loss |
|
2 × 90 Puts |
0 |
|
Net Option Payoff |
-5 |
|
Initial Credit |
+2 |
|
Total P&L |
-3 |
The first two cases show a moderate rise or moderate fall. As can be seen by the pay, the profit and loss are also very moderate.
Case 3: The stock has dropped to 80, which is a sharp drop
|
Component |
Value |
|
100 Put |
20 loss |
|
2 × 90 Puts |
10 × 2 = 20 gain |
|
Net Option Payoff |
0 |
|
Initial Credit |
+2 |
|
Total Profit |
+2 |
Case 4: The stock is at 70, which is a black swan event
|
Component |
Value |
|
100 Put |
30 loss |
|
2 × 90 Puts |
20 × 2 = 40 gain |
|
Net Option Payoff |
+10 |
|
Initial Credit |
+2 |
|
Total Profit |
+12 |
Here is the summary:
|
Stock Price at Expiry |
Total P&L |
|
₹105 |
+2 |
|
₹100 |
+2 |
|
₹95 |
-3 |
|
₹90 |
-8 (Max Loss Zone Approx) |
|
₹80 |
+2 |
|
₹70 |
+12 |
|
₹60 |
+22 |
As we can see, the structure is able to achieve the following:
This creates:
- If there is a very small movement, then the profit and loss is limited
- If the moment is high, then the profit accelerates
- Finally, if there is a Black Swan event, there is positive convexity and long-tail exposure. This means that the strategy actually makes money when there is a Black Swan event
When To Trade the Back Spread Strategy
The strategy performs well when the following happens:
- The volatility is relatively low when the strategies are entered.
- The tail risk is relatively underpriced.
- The trader is expecting a good chance of a systemic shock or a Black Swan event.
- There is probably some macro uncertainty or some news that can shake up the market
- The ideal time is when the move is fast, violent and volatility-driven
The strategy does not perform well in the following cases:
- If the market is moving slowly, then the long strikes will lose money.
- If the volatility does not expand exponentially, then the strategy will also be loss-making
- If the volatility is already high, it is best not to enter the strategy.
Comparing Back Spread vs Long Put
Here is the comparison between the back spread and the long put strategy:
|
Feature |
Long Put |
Put Ratio Back Spread |
|
Structure |
Buy 1 Put |
Sell 1 Higher-Strike Put + Buy 2 Lower-Strike Puts |
|
Initial Cash Flow |
Net Debit (premium paid) |
Small Debit, Zero Cost, or Net Credit (depending on strikes) |
|
Maximum Loss |
Limited to premium paid |
Limited but occurs in the intermediate price zone |
|
Tail Event Benefit |
Linear downside gain |
Accelerating (convex) downside gain |
|
Convexity |
Positive |
Strongly positive beyond the lower strike |
|
Performance in Mild Decline |
Performs well |
May enter loss zone |
|
Performance in Sharp Crash |
Strong gains |
Very strong gains (convex acceleration) |
|
Time Decay Impact |
Negative Theta (always decaying) |
Mixed Theta (can benefit initially if structured well) |
|
Volatility Sensitivity |
Long Vega |
Net Long Vega (often stronger in extreme moves) |
|
Capital Efficiency |
Higher cost |
Lower upfront cost for tail exposure |
|
Complexity |
Simple |
Moderate (multi-leg and payoff zone awareness needed) |
|
Best Use Case |
Direct hedge |
Cheap convex tail hedge |
|
Risk Profile |
Clean and predictable |
Conditional with a defined loss zone |
Conclusion
A backspread is a strategy that capitalises on black swan events. As we know, markets can experience crashes, liquidity shocks, and policy surprises. While most traders suffer during those moments, a back spread strategy allows you to participate in the convex side of chaos.
However, as with any strategy, it is not designed to win every month. However, they can act as insurance and make a profit when the markets are really hurting traders. The strategy leverages option convexity.