Technicals Now Live on the Product Page — Built for Faster, Smarter Trading
Traders on Groww told us something clear: technical indicators are essential to their decision‑making. Until now, many of you jumped to advanced charts for RSI, MACD, moving averages, pivots, delivery volumes and more, even for a quick glance, breaking your flow right before placing a trade
Today, we are changing that. Technicals are now live to the product page, designed for clarity, speed, and actionability — so you can read momentum and levels at a glance and execute without leaving Groww.
What’s New?
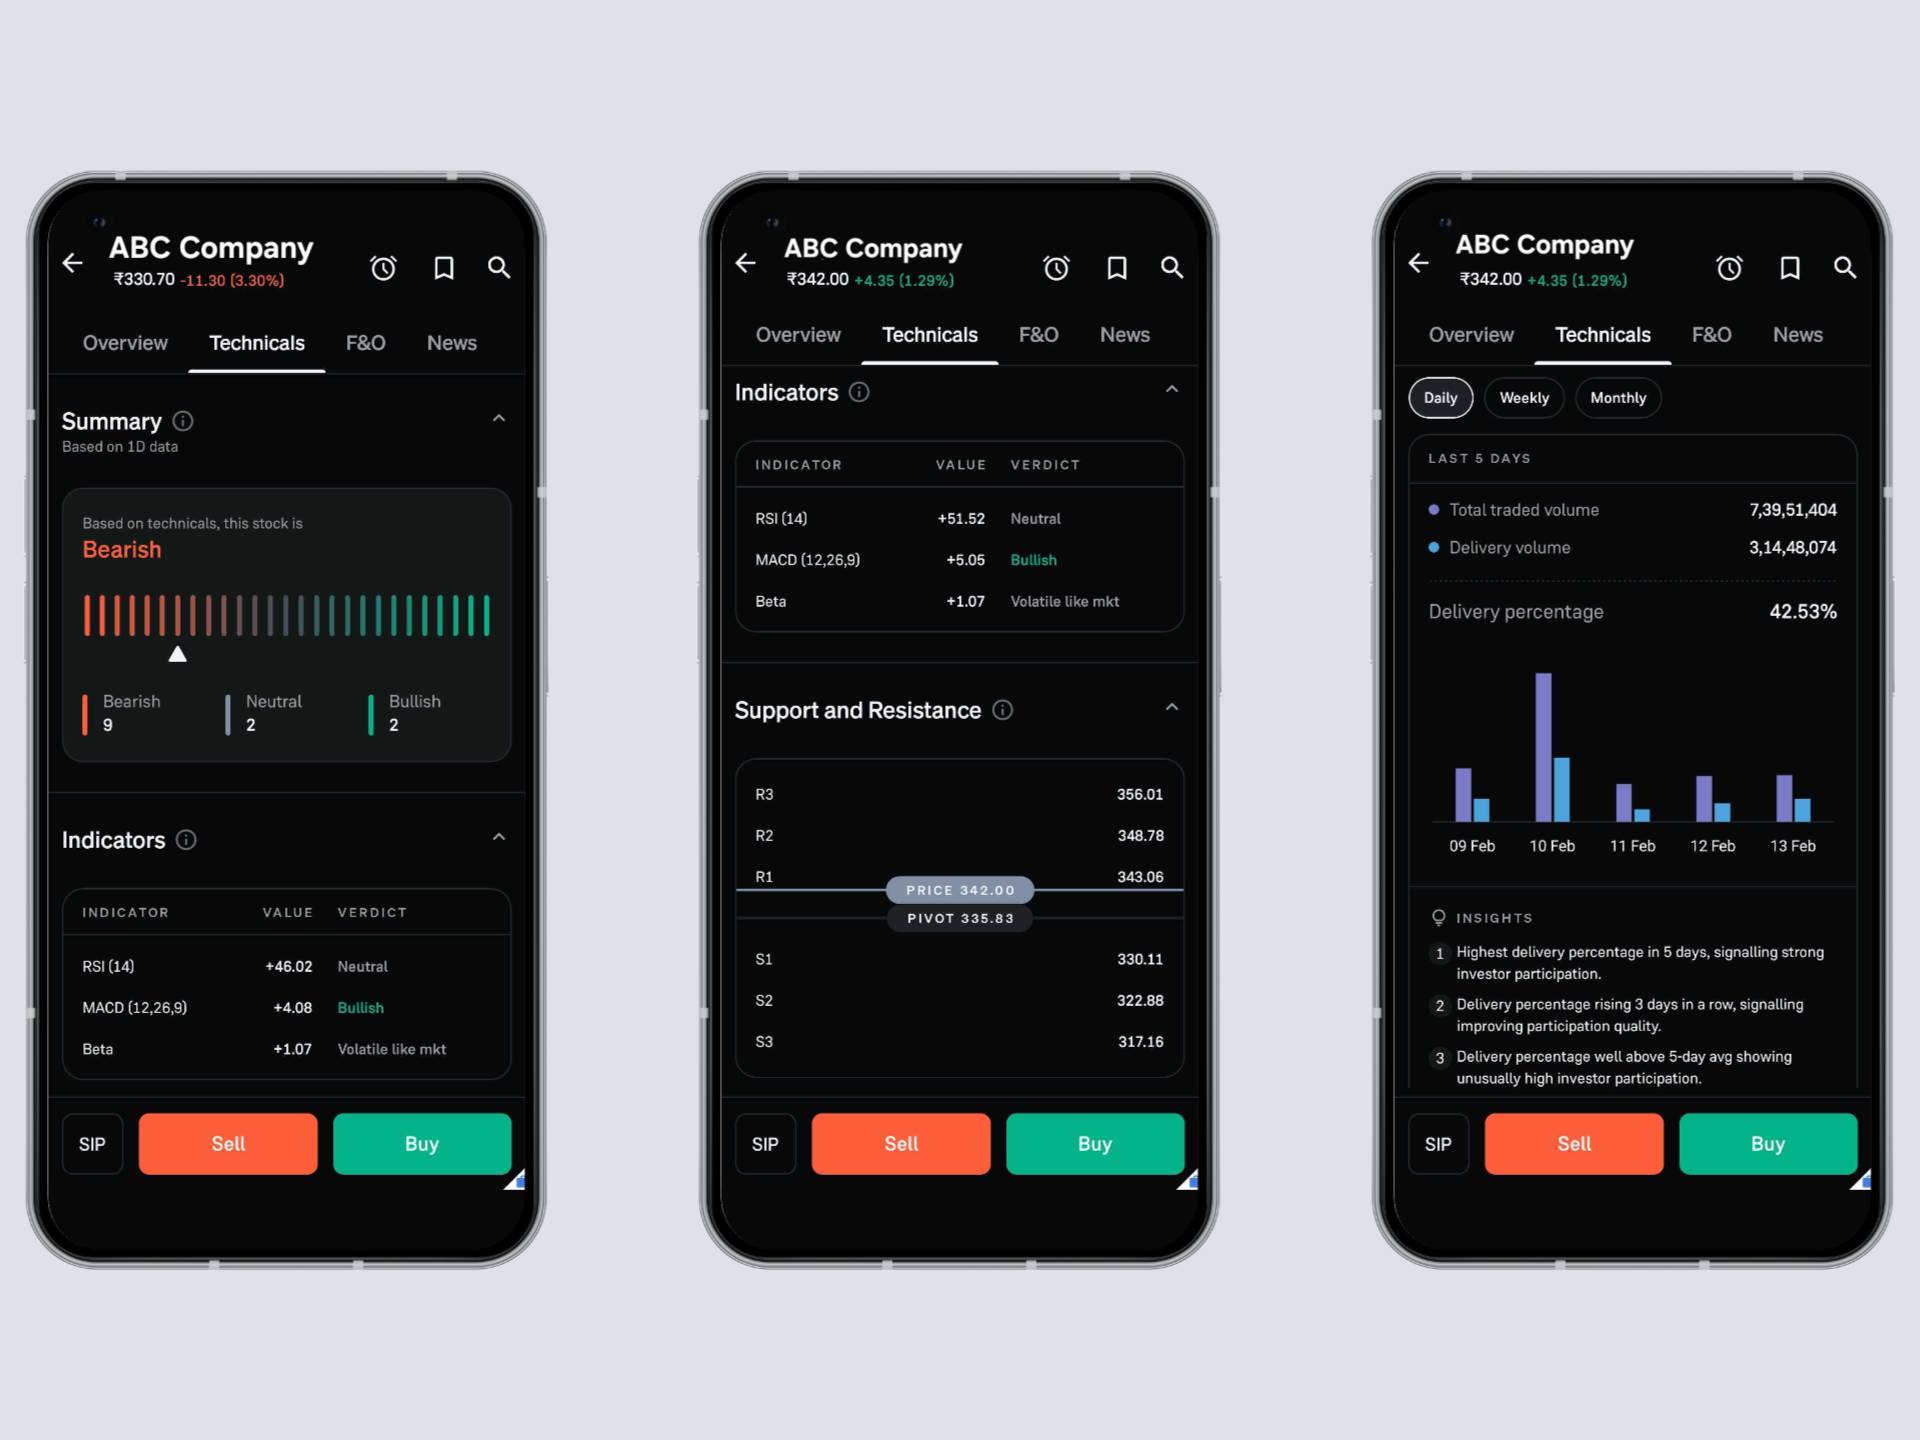
At Groww, we have re‑designed the Performance section on our Product page. You can now get a technical overview that combines Price & Volume + Key Technicals into a single, scannable snapshot. Here are the key indicators that are included:
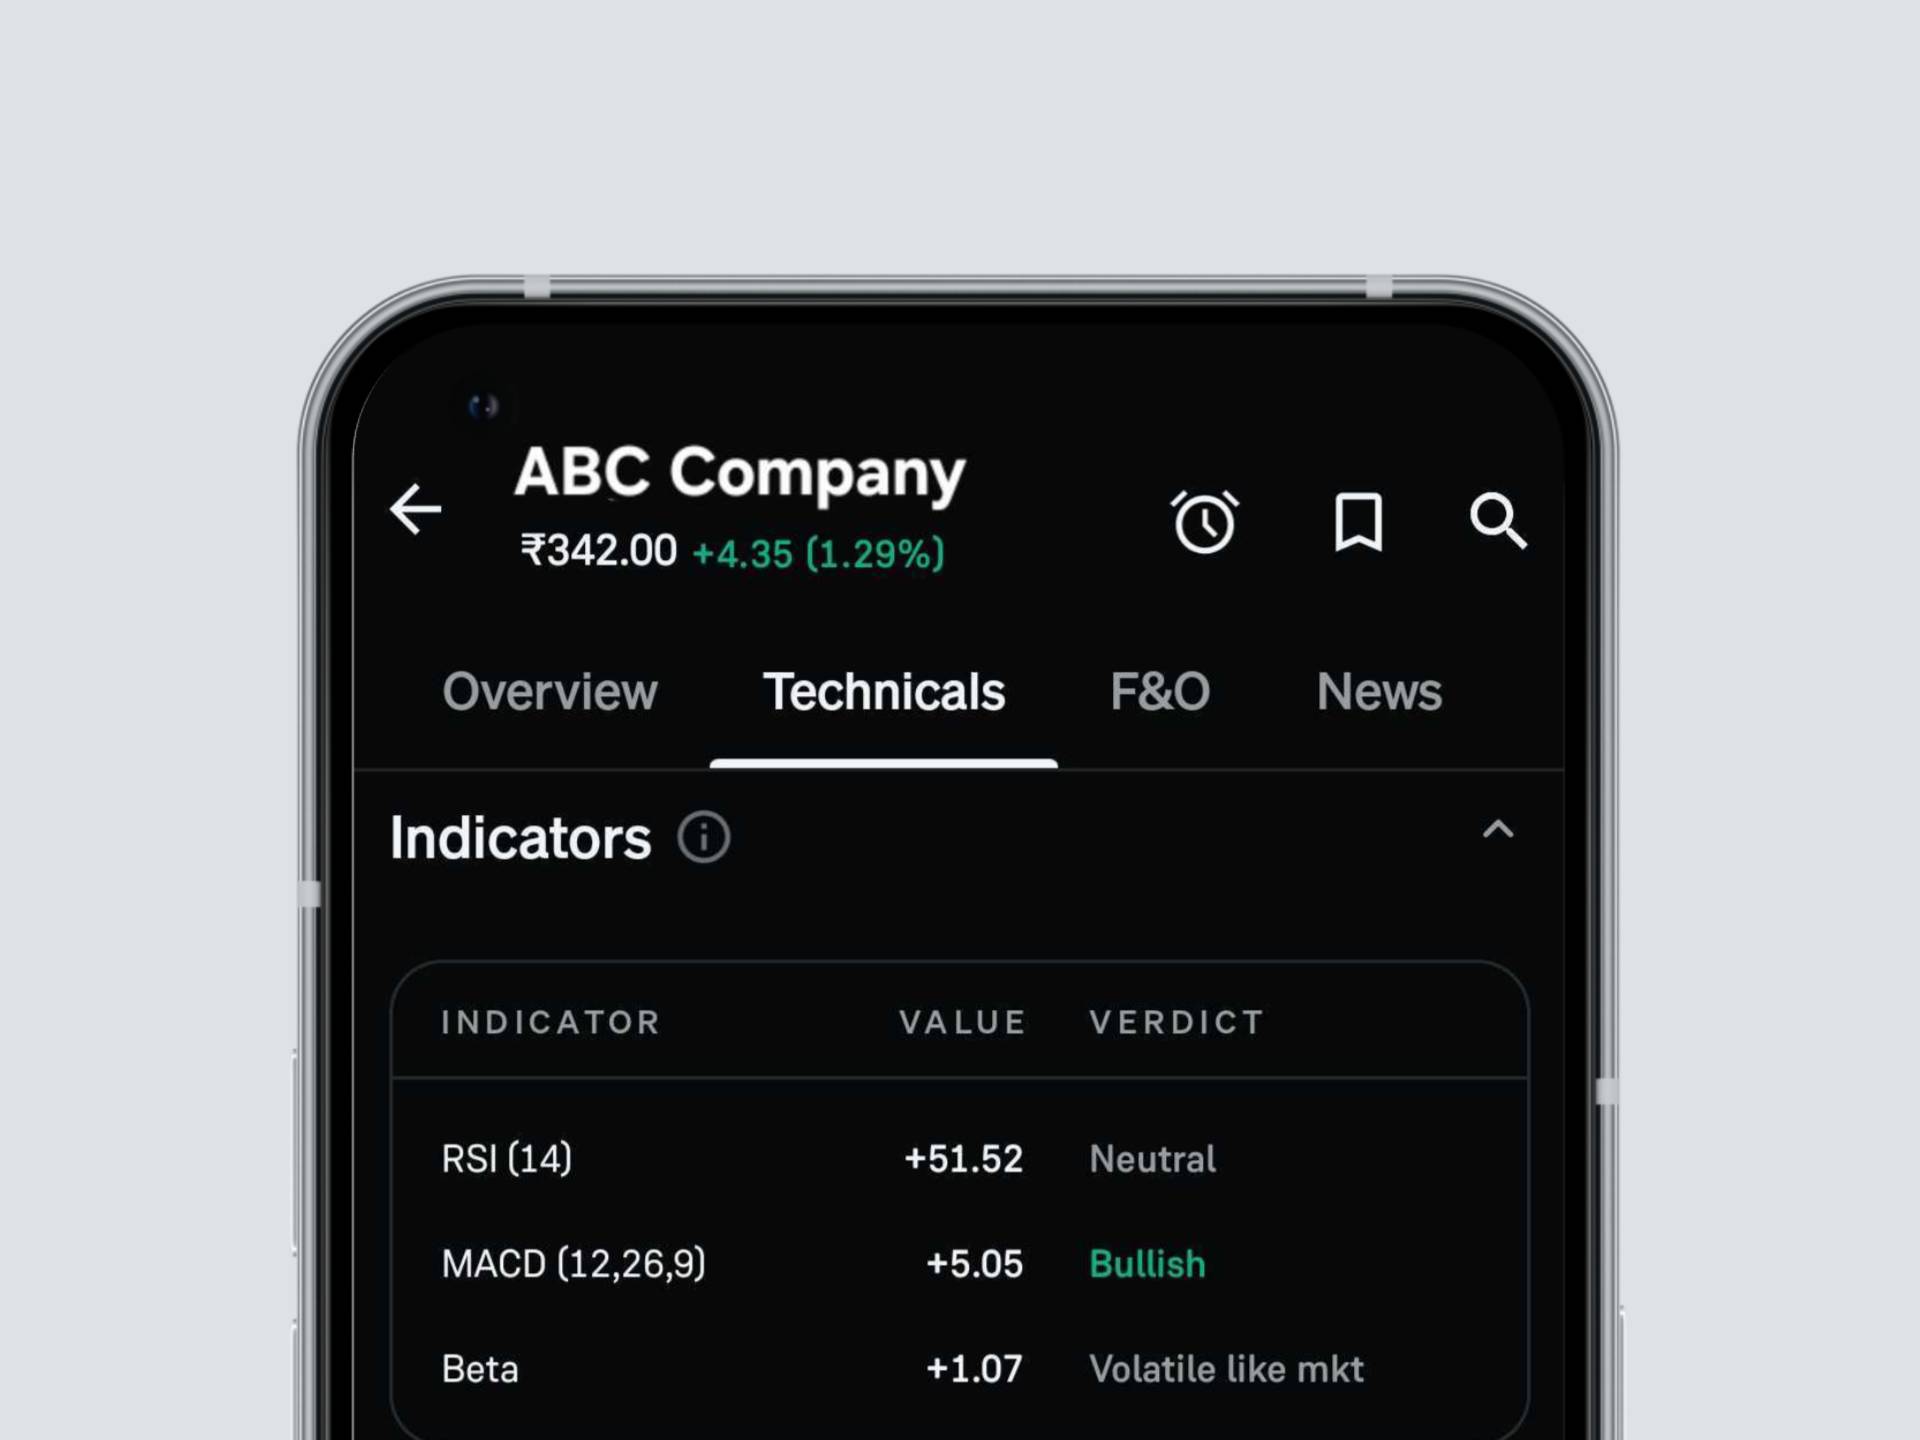
- RSI (Relative Strength Index) — shows whether a stock is overbought or oversold. Helpful for identifying potential reversals or corrections.
- MACD (Moving Average Convergence Divergence) — helps track changes in momentum and trend direction.
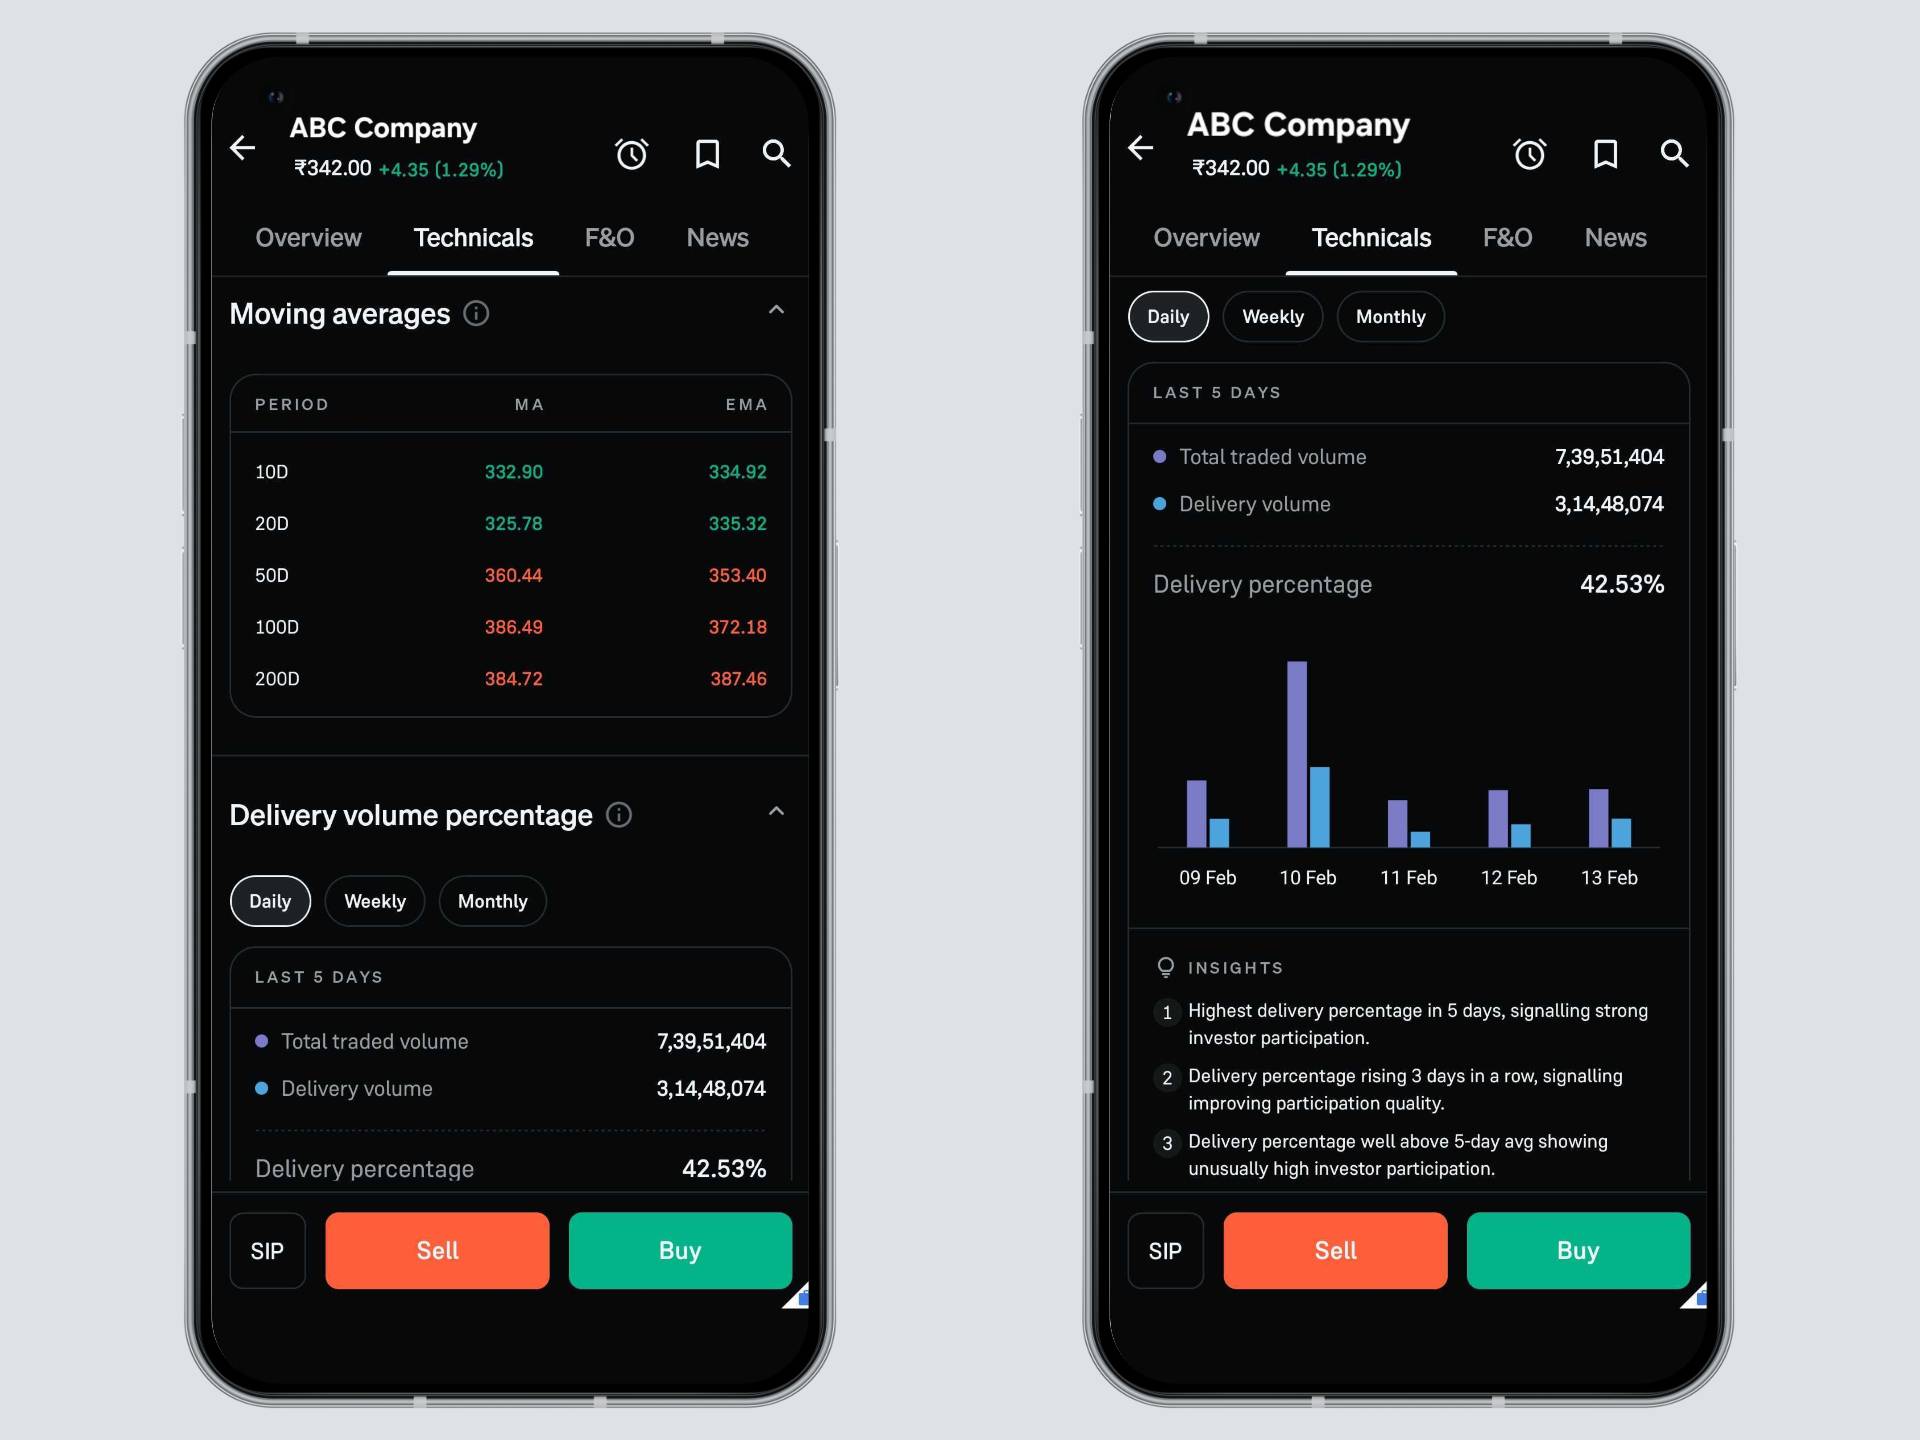
- Moving Averages (SMA & EMA) — smooth out short-term noise to show long-term trend direction. Useful for spotting trend continuations or reversals.
- Pivot Points (Classic) — reveal important support and resistance levels. Great for planning entries, stop losses, and targets.
- Volume comparison — compares today’s volume with past averages to check if the move has real participation behind it.
- Delivery % (EOD) — shows what proportion of trading volume turned into actual delivery, signaling whether serious investors or short-term traders are driving the price.
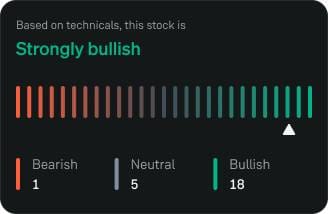
Colour-Coded Indicator Signals
Every indicator shows a verdict using intuitive colour codes:
Bullish – positive bias or strength building.
Neutral – indecisive or sideways phase.
Bearish – potential weakness or loss of momentum.
The new layout gives you all the key signals at one glance. Just scan the section, understand momentum and trend instantly, and decide whether to dig deeper or act.
Why We Changed This?
We heard from many of our users that while technical indicators are essential to their strategy, accessing them often meant switching to advanced charts which was interrupting their trading flow.
While traders already check price vs Day High/Low, 52-Week High/Low, circuits, volume, and market depth on the product page. However, price and volume alone don’t always confirm strength or direction, validating momentum required an extra step.
That’s why we built Technicals on the Product Page to close that gap.
By bringing structured indicators directly into your trading view, you can now validate momentum, trend, and participation instantly without switching screens.
These technical indicators convert the price and volume data into structured trading signals.
- RSI spot overbought/oversold zones
- MACD read momentum and early trend shifts
- Moving Averages (SMA/EMA) to assess trend and crossovers
- Pivot Points to frame intraday supports/resistances
How to Read the Indicators?
RSI (14‑Day)
The RSI measures how quickly prices are rising or falling. It ranges from 0–100 and helps identify when a stock is overbought or oversold.
- Above 70: Overbought
- 30 – 70: Neutral
- Below 30: Oversold
Helpful for: spotting short‑term reversals or entry points after extreme moves.
MACD (12,26,9)
It tracks momentum using short- and long-term averages.
- Above 0 → Bullish momentum
- Below 0 → Bearish momentum
- Signal crossover → Possible trend shift
Helpful for: catching early signs of trend reversals or confirming ongoing momentum.
Moving Averages (SMA/EMA)
Highlight overall trend direction.
- SMA (Simple Moving Average) → Long-term trend
- EMA (Exponential Moving Average) → Short-term momentum
Helpful for: identifying trend continuation or crossovers.
Pivot Points
Pivots are used by traders to identify support and resistance levels. These are areas where price movement often slows down or reverses.
- Price above R1 → Bullish strength.
- Between S1 and R1 → Neutral zone.
- Below S1 → Bearish pressure.
Helpful for: planning entries, exits, and stop‑loss zones during intraday trading.
Volume & Delivery %
Volume tells you how many shares traded during the day. Comparing today’s volume to its 1‑week average helps confirm if a move is meaningful.
Delivery % shows how much of that volume turned into actual ownership transfers:
- High Delivery % + Price Rise → Strong buying by investors (accumulation).
- Low Delivery % + Price Rise → Likely speculative move.
- High Delivery % + Price Fall → Heavy selling or institutional exit.
Helpful for: understanding whether moves are driven by traders or genuine investors.
How to Access Technicals on Groww?
Technicals are now available directly on the Product Page for stocks.
- Open any stock on the Groww app or web platform.
- Scroll to the Performance section on the Product Page.
- View the Technical Overview tab, where price, volume, and key technical indicators are presented together in one structured snapshot.
- Check the colour-coded signals for an instant view of momentum and trend bias.
Try Technicals on the product page today and trade with confidence without breaking your flow.
— Team Groww