Introducing Advance Payoff: See Your Strategy Before Expiry
If you have traded options before, you have likely seen a payoff chart that shows your profit or loss only on expiry day.
But here’s the problem, most traders don’t actually hold their positions till expiry. You might exit early, adjust your strategy, or book profits midway.
So naturally, one question keeps coming up: “What does my P&L look like before expiry?”
That’s exactly what we are solving with Advance Payoff.
What is Advance Payoff?
Advance Payoff is an upgraded payoff chart for your options strategies. It lets you:
- See your expected profit or loss at any date before expiry.
- Compare it with your final expiry outcome on the same chart.
How it Works?
Advance Payoff uses a standard pricing model (called Black–Scholes) to estimate what your option positions could be worth at any selected date. Think of it as a “what-if” tool for your strategy.
- You pick a date
- We calculate the expected value of each leg
- And show your overall strategy P&L
The best part?
It is live and interactive.
Change the date, tweak your strategy, or move the price and the chart updates in real time, helping you explore different scenarios in seconds.
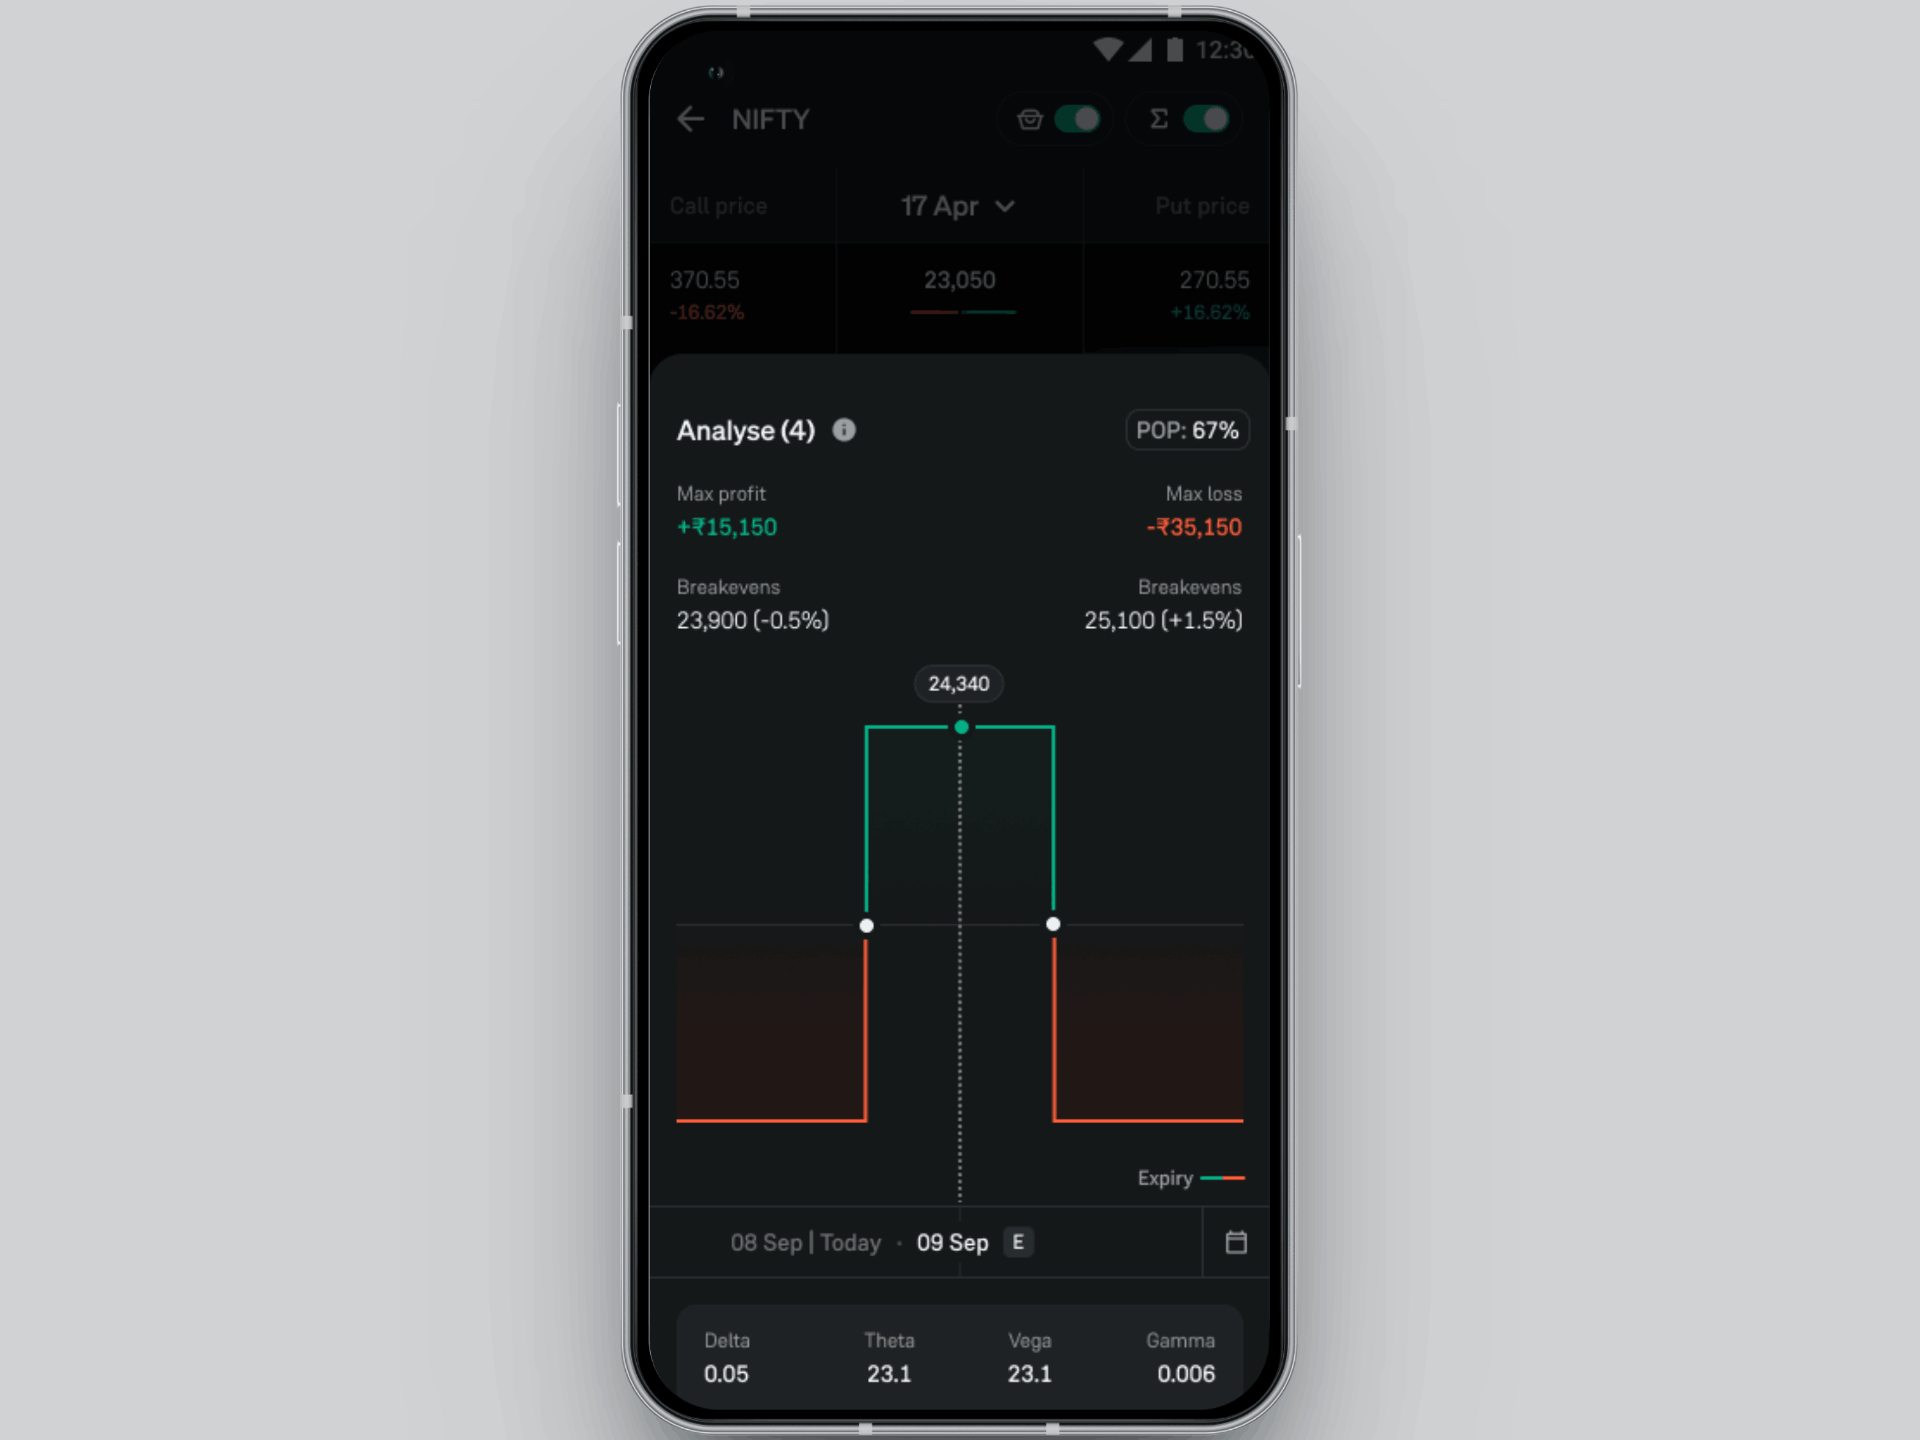
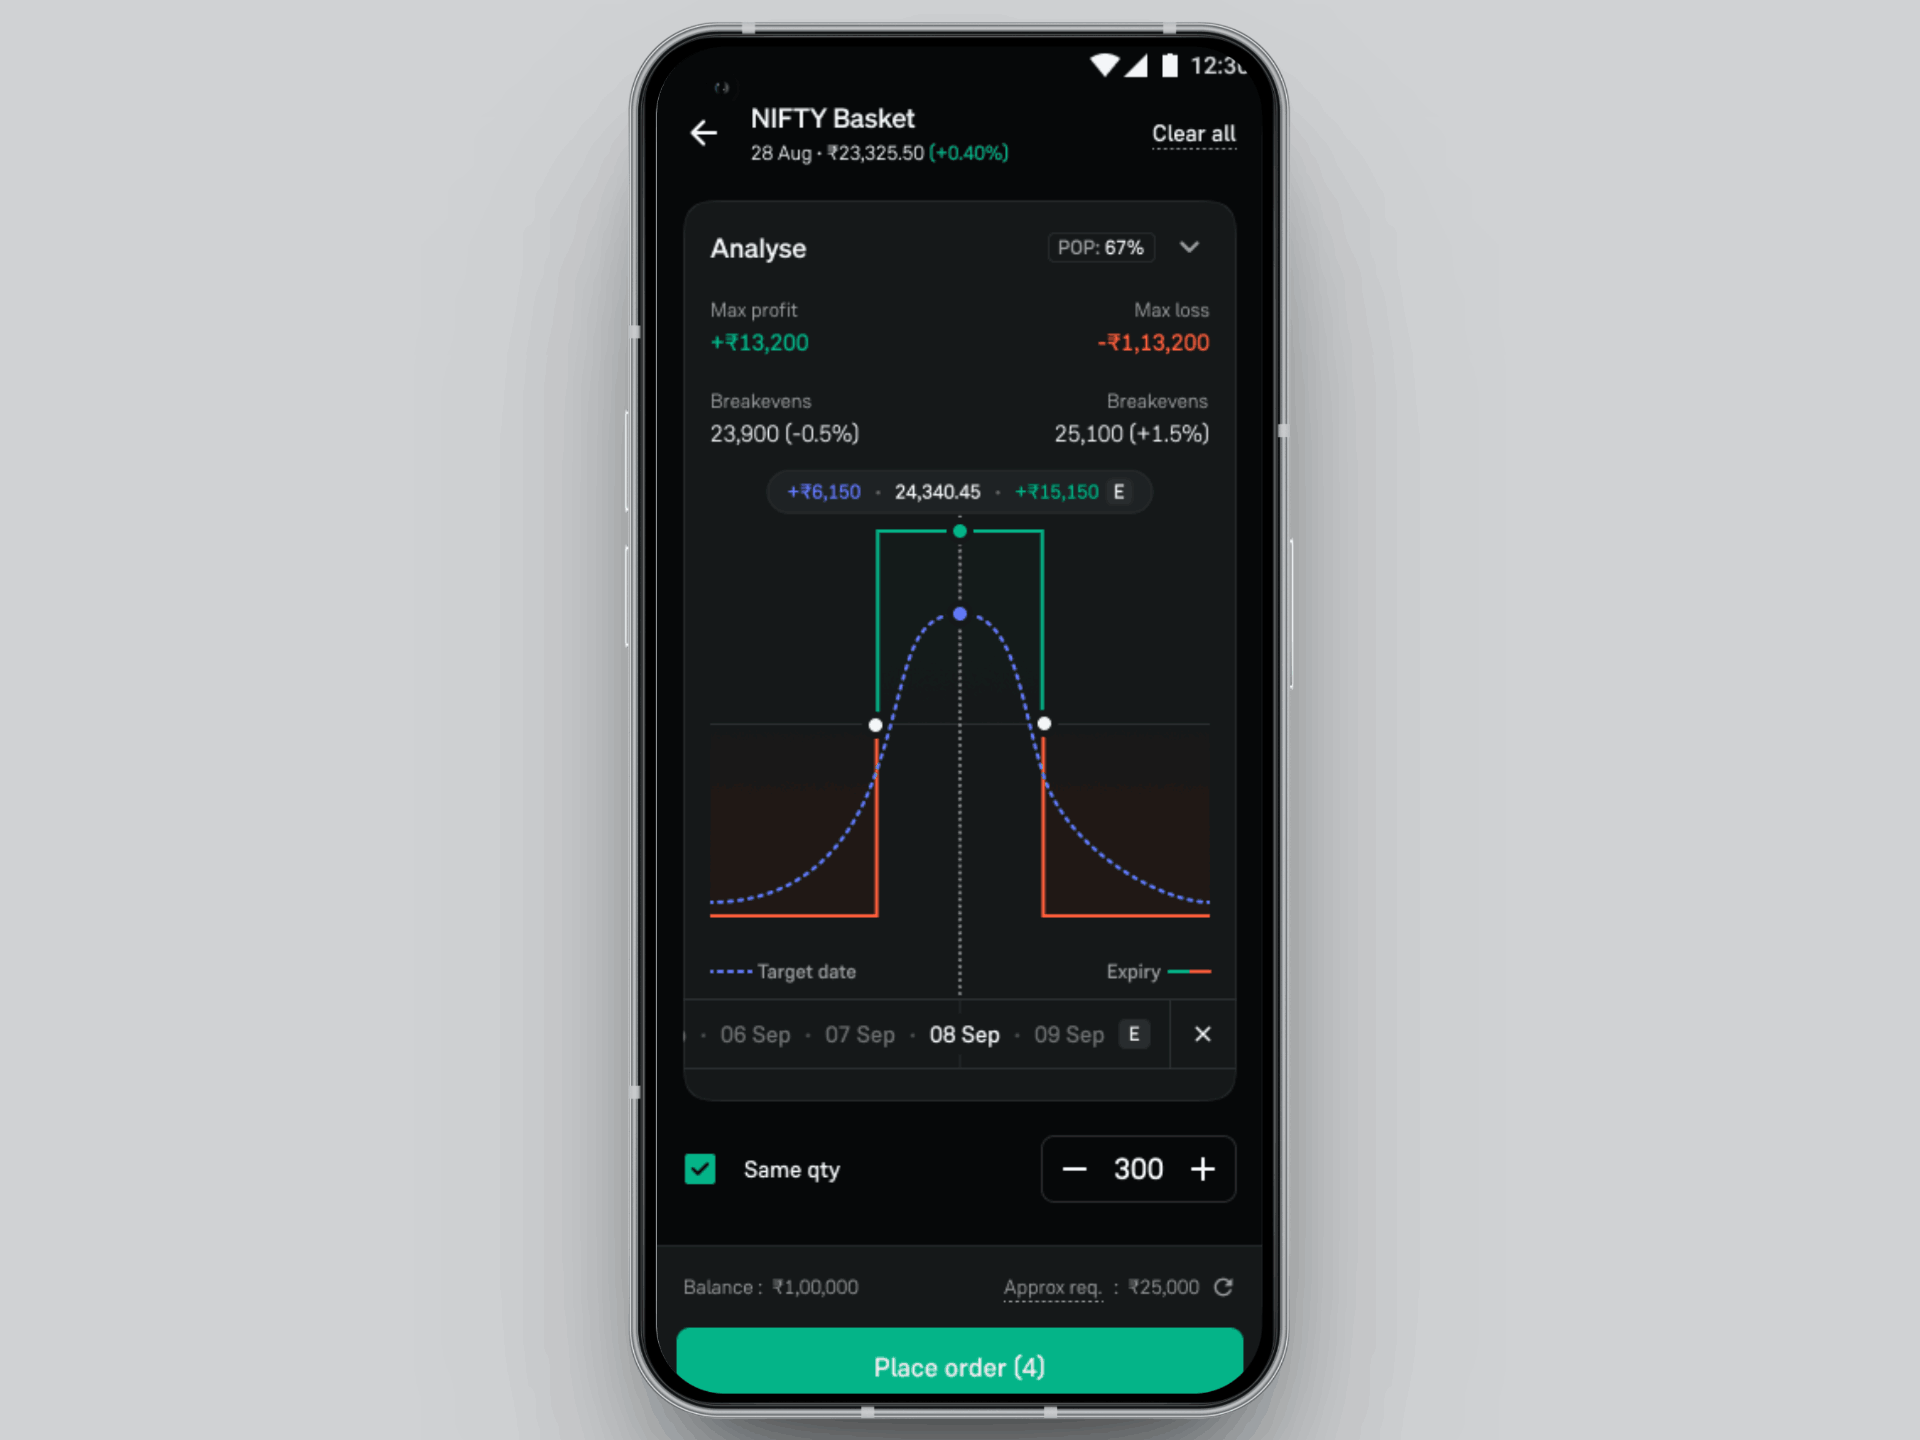
Understanding the Payoff Chart
1. Expiry line (Solid line)
- This is your final payoff
- It shows what happens if you hold till expiry
- This line is fixed and it doesn’t change
2. Selected date line (Dotted line)
- This shows your expected P&L at the chosen date
- It updates in real time when you:
- Change date or time
- Adjust your strategy
- Move the underlying price
With Advance Payoff, you’re not locked into expiry anymore. You can:
- Select any date before expiry and see how your strategy might perform on that day.
- This is especially useful on non-expiry days, when you want to understand your current P&L or plan your next move instead of waiting till the end.
- You can also view combined Greeks at the position level right below the payoff, giving you a clearer picture of how your entire strategy reacts to price, time, and volatility.
Want to see what happens 2 days later at 2 PM?
Or how your strategy behaves a week before expiry?
Just select it and the chart updates instantly.
As you change the date, here are the key metrics that gets updated too:
- Max Profit → Best-case outcome for your strategy
- Max Loss → Worst-case scenario
- Breakeven Points → Where profit turns into loss (or vice versa)
- POP (Probability of Profit) → Chances of your strategy ending in profit
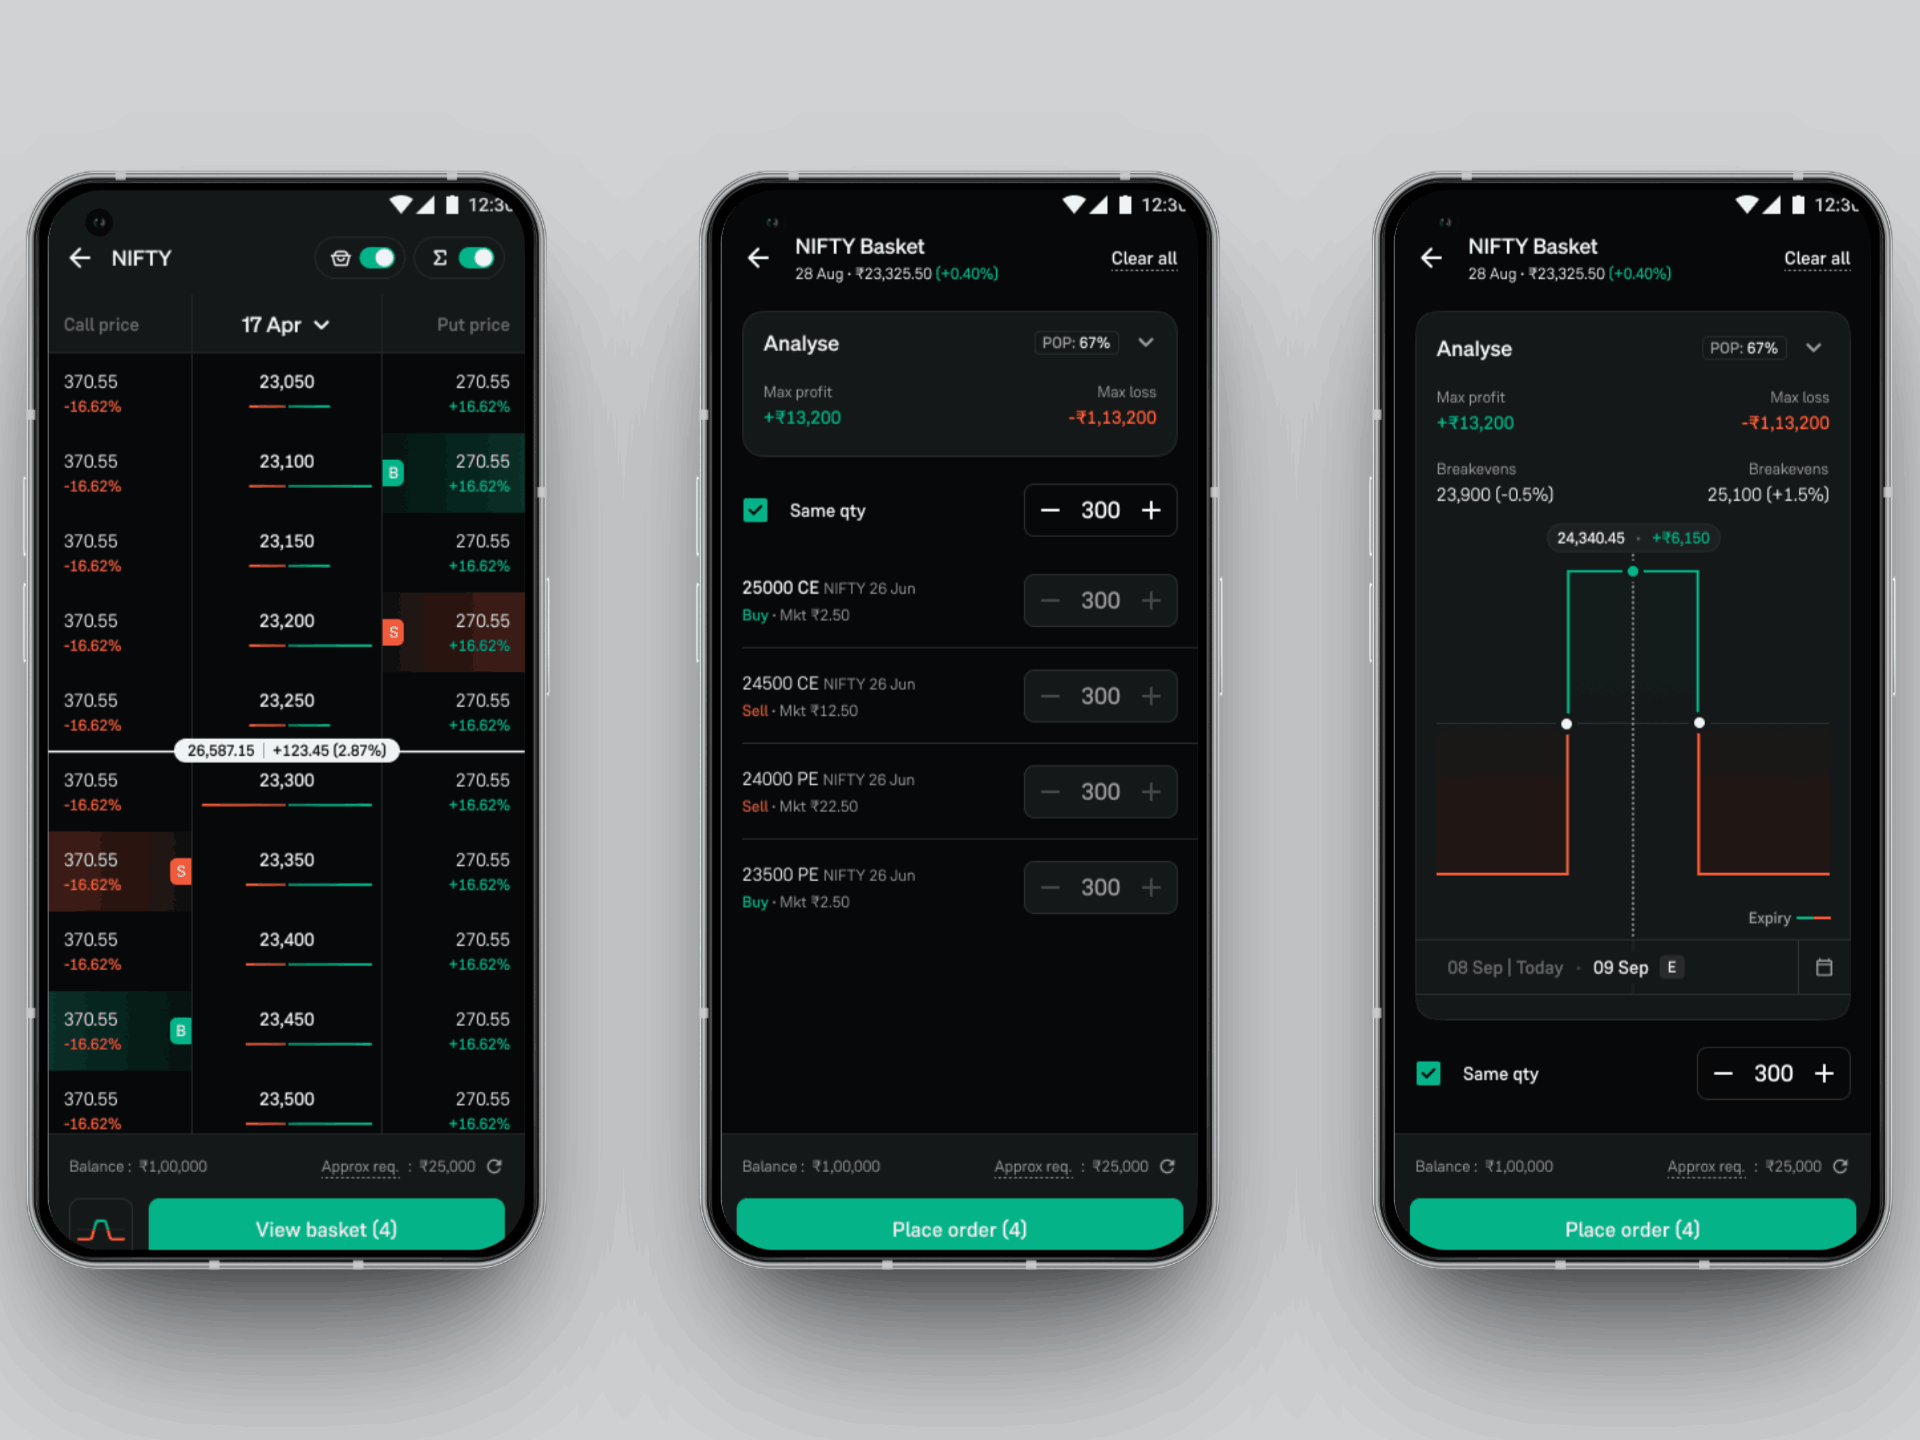
How to use Advance Payoff on Groww?
- Open Groww and go to the F&O tab.
- Either open an existing position from the Positions tab or build a new strategy.
- Tap on View Basket.
- In the basket, go to the Analyse section and tap the expand arrow to view the payoff chart.
- Use the date selector to pick any day before expiry.
- Watch how the dotted line and key metrics update instantly.
Need more insights? Turn on Greeks
For traders who want extra clarity, Greek mode gives you a deeper view.
Track Delta, Theta, Vega, and Gamma at a strategy level to understand how your position changes with price, time, and volatility.
With Advance Payoff, you can move beyond a static view and understand how your strategy evolves at every step. Whether you're planning an early exit, adjusting positions, or simply exploring scenarios, you now have the clarity to make better decisions.
Head to the F&O section on Groww, try out Advance Payoff in your basket.
Still have some doubts?
Refer to these FAQs below to understand how it works.
Frequently Asked Questions
1. What is POP?
Probability of Profit (POP) is a statistical estimate of the likelihood that your trade will finish in a profitable position. It calculates the chance of the underlying price staying beyond your strategy’s breakeven points at any given time.
2. How accurate is POP?
POP is a theoretical forecast based on the Black-Scholes model. Its accuracy depends on market conditions remaining within "normal" distributions.
Please note: As you get closer to expiry, POP becomes more sensitive to price swings (Gamma risk), meaning values can shift rapidly in the final days of a contract.
3. How is the dotted blue line calculated?
The dotted line is your Target-Date Payoff. While the solid line shows your P/L at expiry, the dotted line uses the Black-Scholes engine to simulate what your P/L would look like today (or on a chosen future date). It accounts for time value and volatility.
4. How are Strategy Greeks calculated?
We calculate Greeks (Delta, Gamma, Theta, Vega) for every individual leg in your strategy and aggregate them:
- Long Legs: Added to the total.
- Short Legs: Subtracted from the total. This gives you a single, unified view of your strategy’s overall risk.
5. Why have the values (P0P, dotted line) changed?
Values like POP and Greeks are dynamic. They will update every 10 seconds based on:
- Time Decay: As time passes, the "time value" of your options decreases.
- Market Movement: Shifts in the underlying price.
- Volatility (IV): Changes in market expectations of future price swings.
Other Updates