Groww's MTF P&L Viewer - Track & Review Your MTF Performance
Hello users,
Tracking your Margin Trading Facility (MTF) performance just got a major upgrade.
Earlier, MTF profits and losses were merged inside your consolidated Stocks P&L. We heard your feedback loud and clear: you wanted a dedicated space to understand, and track your MTF returns.
We are excited to introduce the MTF P&L Viewer — a simpler, smarter, and dedicated view inside Groww, designed to give you complete visibility over your MTF trades, returns, and associated charges.
What is the MTF P&L Viewer?
The MTF P&L view is a dedicated section under Reports that pulls your MTF trades into a clean, focused view.
Instead of shifting through consolidated statements or manually calculating borrowing costs and net returns, you can now:
- Filter exclusively for "MTF only" trades.
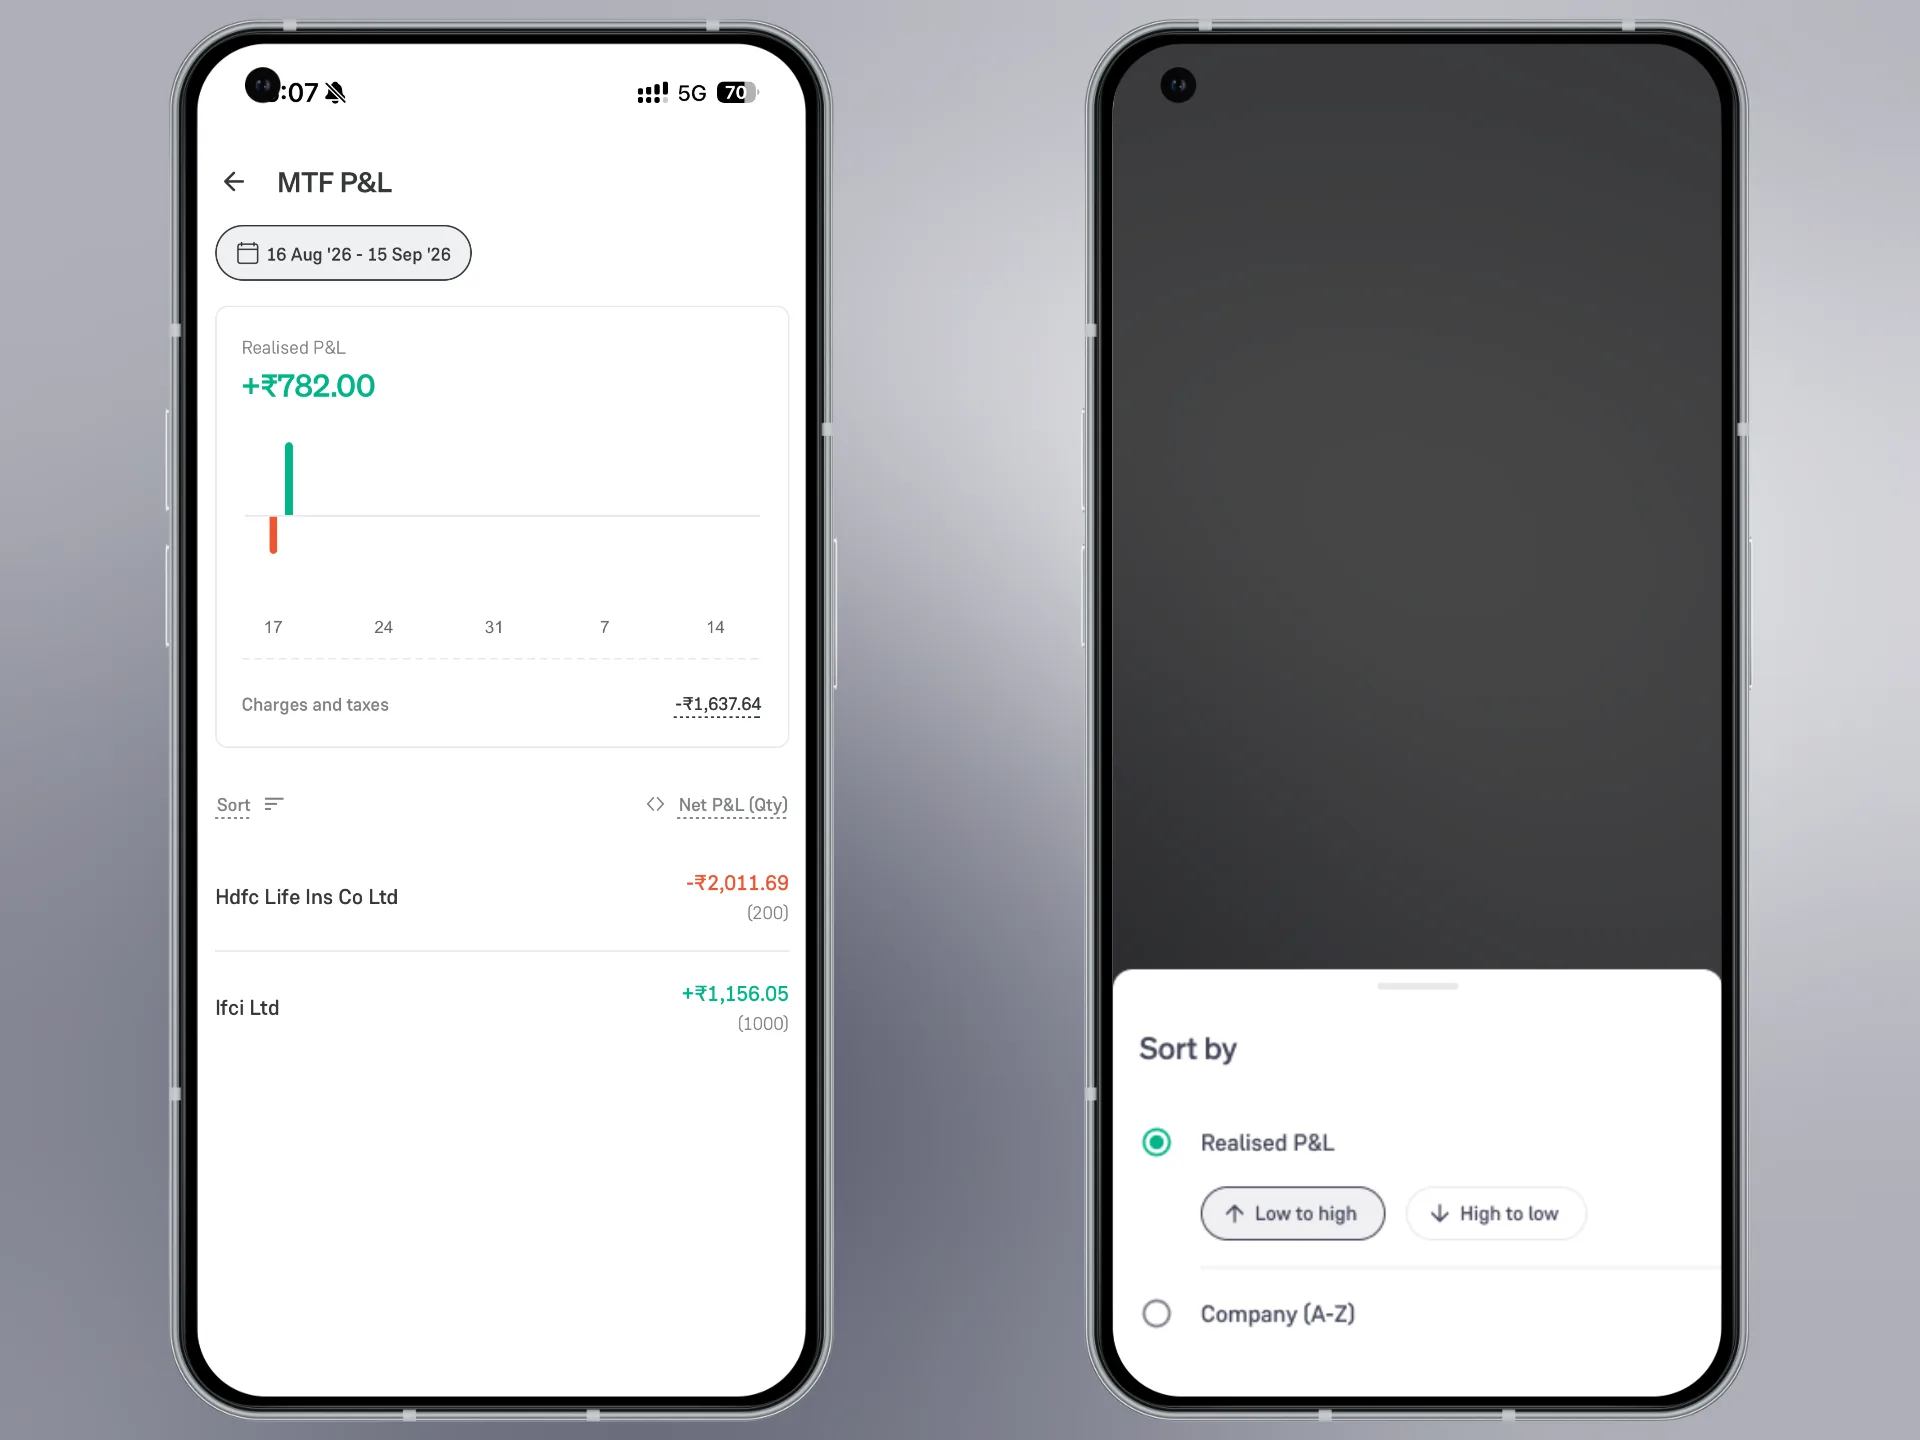
- View a detailed Realised P&L summary with month-on-month bar charts.
- Get a detailed breakdown of all MTF-related charges and taxes.
- Filter and customize performance across different timeframes.
- Track company-wise insights with sorting options to instantly find top gainers and losers.
Why Do You Need a Dedicated MTF P&L View?
Standard stock P&L statements use FIFO (First In, First Out) rules. FIFO works great for taxes, but it gets confusing if you own the same stock in both regular holdings and MTF.
What MTF traders actually need to know is: "Did my specific MTF trade pay off?"
For example,
Let’s say you already own 100 shares of a stock, bought at ₹1,000 each.
Later, you buy another 100 shares of the same stock through MTF at ₹900 each and sell these MTF shares at ₹930 each.
Your MTF trade makes a gross profit of -
(₹930 − ₹900) × 100 = ₹3,000
However, for tax reporting, the sale may be matched with your older shares first under the FIFO (First In, First Out) method.
In that case, the sale is matched with the shares you originally bought at ₹1,000. This results in a loss on the tax statement of -
(₹930 − ₹1,000) × 100 = −₹7,000
The MTF P&L view keeps the MTF trade separate, so you can see the actual ₹3,000 gross profit made from that MTF trade.
But the stock price difference is not the only cost of an MTF trade. You may also have to pay daily interest and other borrowing charges. The MTF P&L view accounts for these charges and deducts them from the gross profit, helping you see your actual net return from the trade.
Key Feature Highlights
➡️ Dedicated "MTF Only" Tab
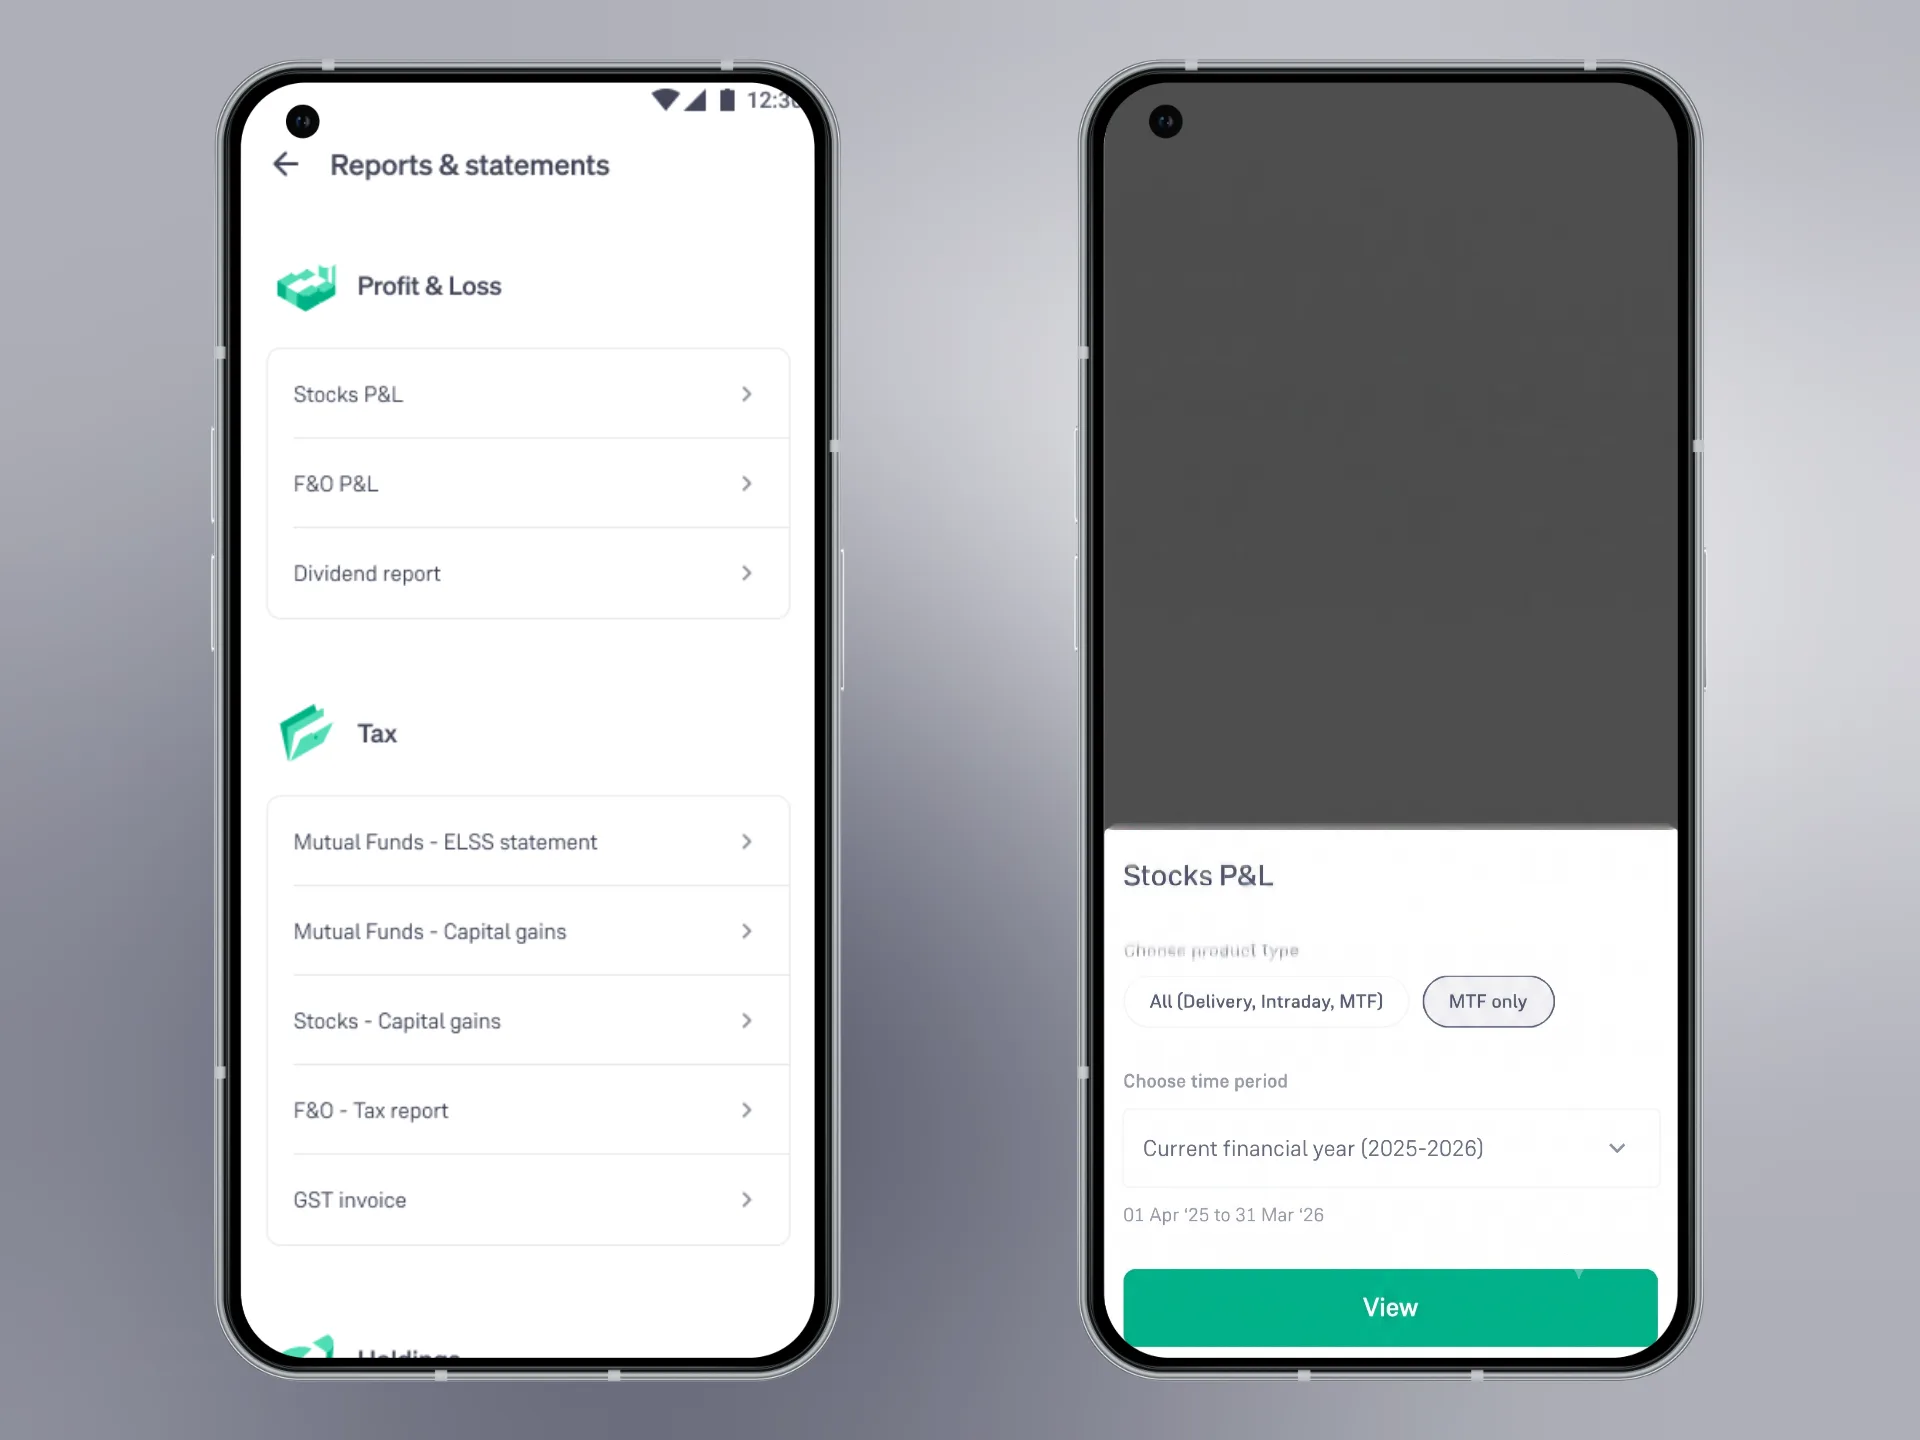
When viewing your Stocks P&L, simply select "MTF only" under product type to filter out Delivery and Intraday trades.
➡️ Realised P&L Visual Breakdown
Get an immediate snapshot of your realized gains or losses with an intuitive, colour-coded monthly chart.
- Track month-by-month profit trends.
- Easily identify profitable months versus periods that required adjustment.
- View your total Realised P&L at a glance.
➡️ Transparent & Detailed Charges Screen
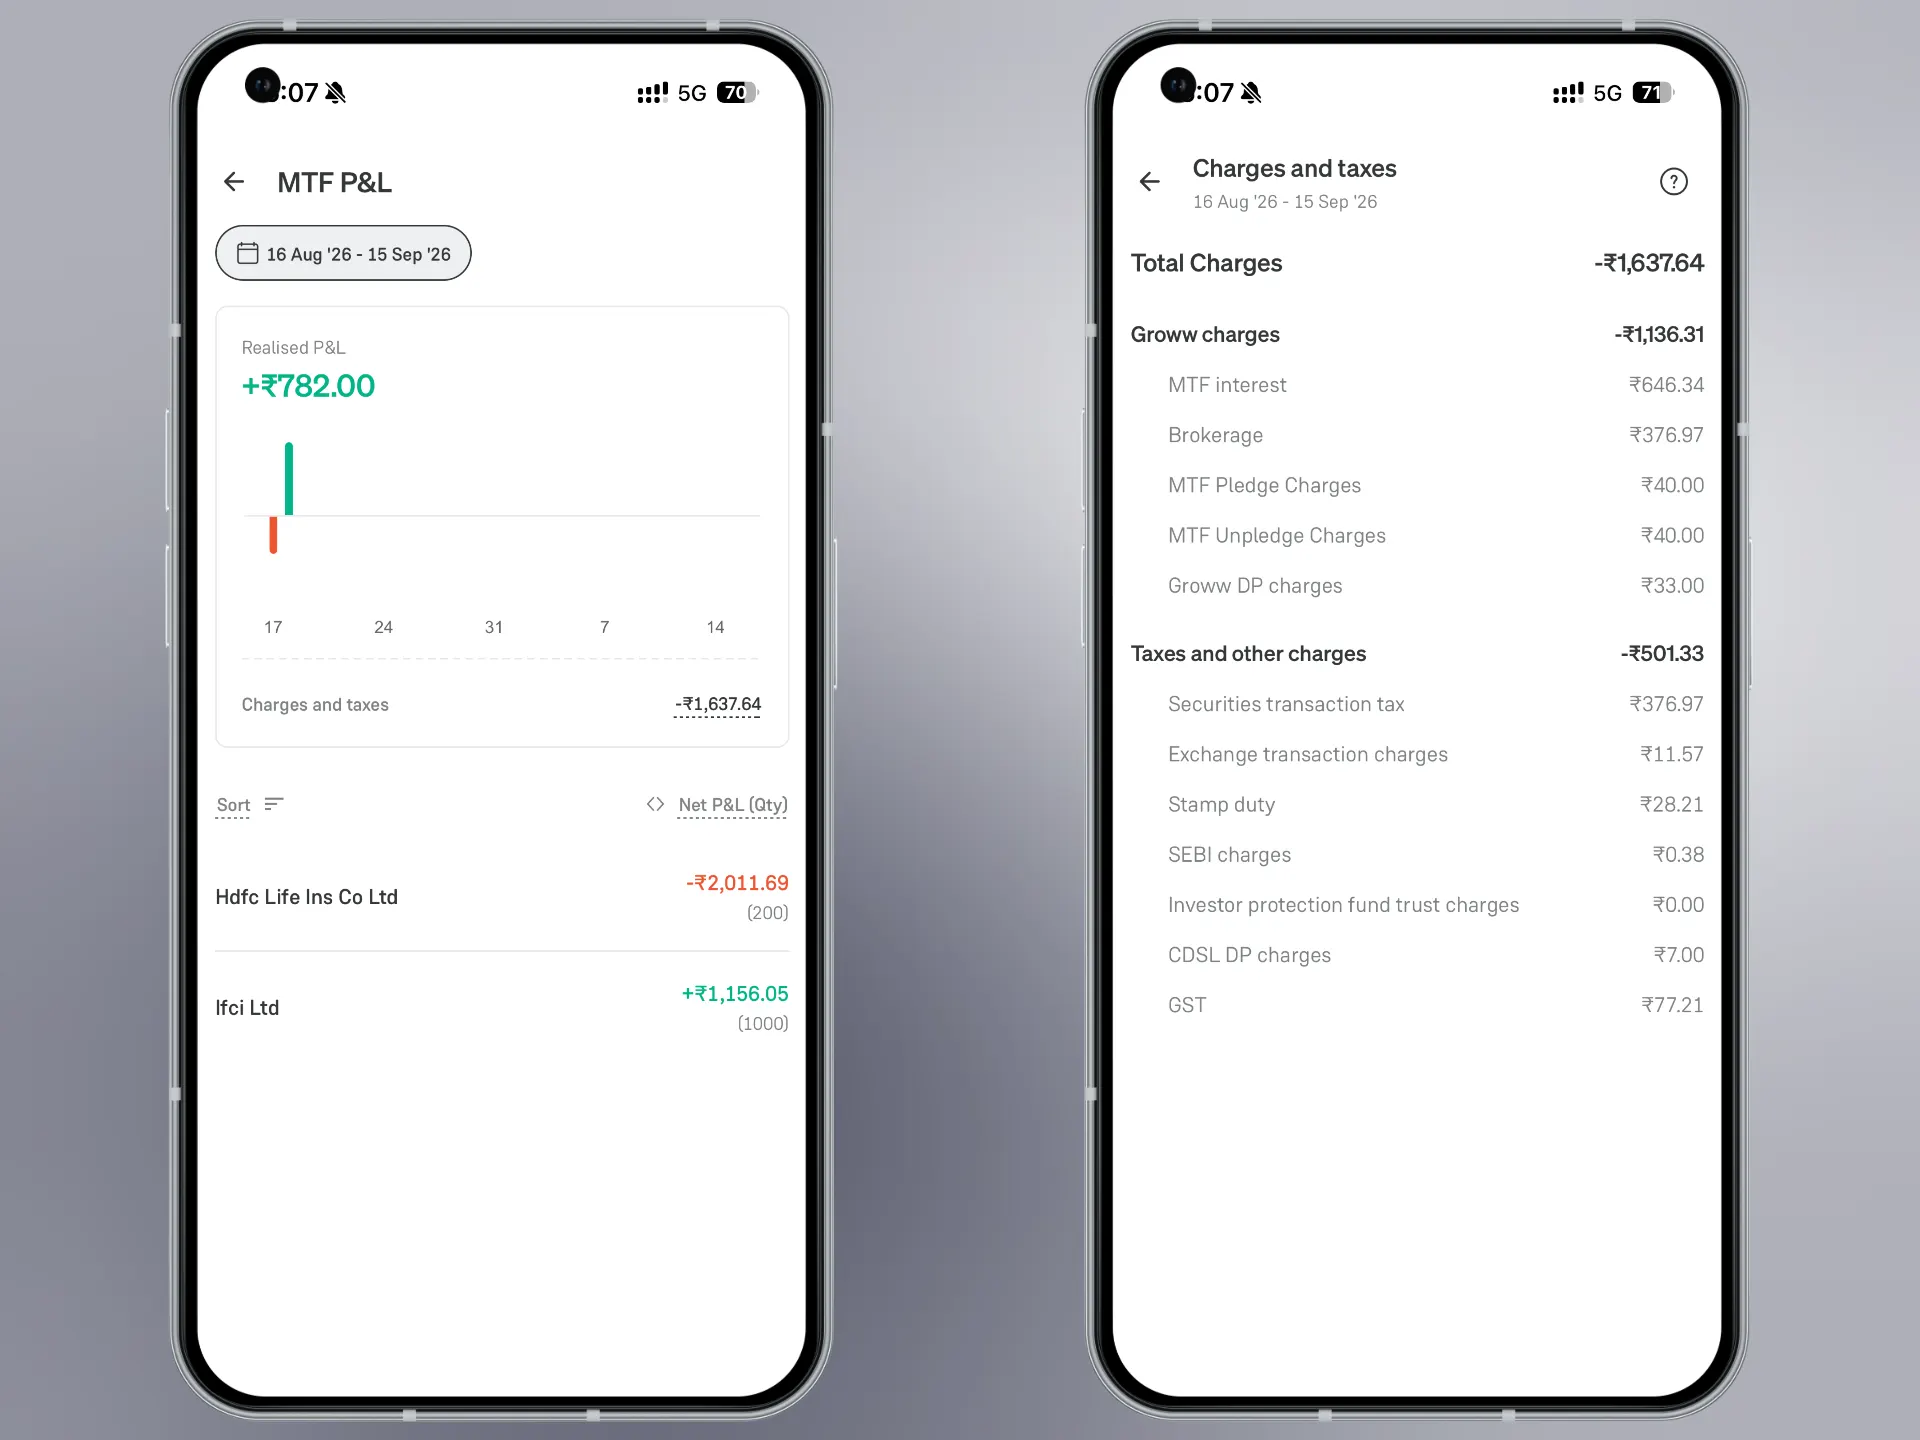
Tap on Charges to view a full breakdown split into three easy-to-understand categories:
- Groww Charges: Brokerage, MTF Interest, MTF Pledge charges, MTF Unpledge charges, and Groww DP charges.
- External Charges: Exchange transaction charges, Investor Protection Trust Fund (IPTF), SEBI turnover fees, Stamp duty, and CDSL charges.
- Taxes: GST and Securities Transaction Tax (STT).
➡️ Customizable Time Periods
Choose exactly what timeframe you want to review:
- Select preset options like the Current Financial Year.
- Define custom date ranges to analyze specific holding periods.
➡️ Company-Wise Insights & Sorting
Want to know which individual stock generated maximum profit or incurred the highest charges?
Under the dashboard graph, view your stock list and switch between key metrics with quick tap controls:
- Net P&L (Qty): See overall profit or loss per stock including costs.
- Realised P&L (Qty): View booked profits for each individual company.
- Charges: See exact charges incurred per stock.
Tap on Sort to organize your stock-level view:
- Realised P&L: Low to High or High to Low.
- Company: Alphabetically (A–Z).
How to Access the MTF P&L Viewer on Groww?
Accessing your MTF P&L View takes just a few taps:
- Open the Groww app and tap on your Profile Icon at the top.
- Select Reports & statements.
- Under the Profit & Loss section, tap on Stocks P&L.
- Select MTF only under Choose product type.
- Select your desired time period and tap View.
Ready to check your numbers?
Update your Groww app to the latest version and explore your MTF P&L viewer today!
— Team Groww
Other Updates