Trend Analysis: How to Identify & Analyse Market Trends
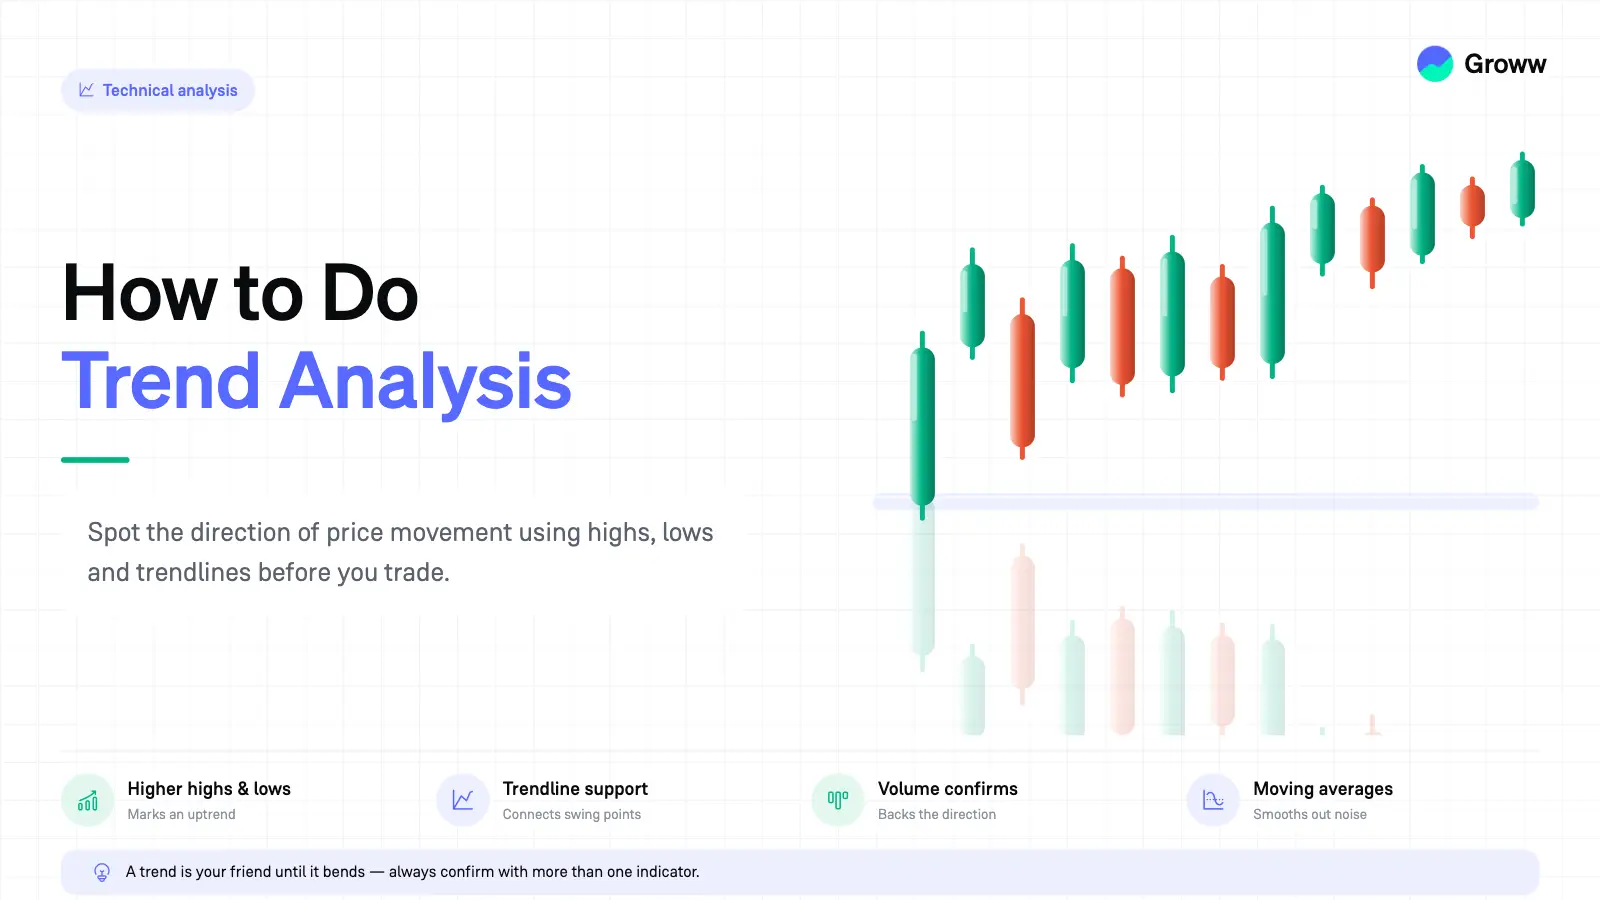


When it comes to Stock Investing, it is critical for investors to understand how the market works. One of the most important things to learn in order to understand this is Trend Analysis. But before we begin, let’s understand the concept of Trends in the Stock Market.
What is a Market Trend?
Trend refers to the direction in which the price of a stock is moving. Share prices usually move upwards or downwards based on bullish or bearish market sentiments. Usually, they do not move in a straight line as stock prices can be subject to high volatility in the short term. Investors need to consider a specific timeframe to consider the stock price movements as a trend.
Individuals can identify a much more defined market trend when they consider somewhat long-term price movements. In other words, the longer a trend moves upward or downward, the easier it is to identify it.
Understanding Trend Analysis
Share market trend analysis is a process that allows investors to estimate the future price movements of stocks by analyzing the ongoing Market Trend. Trend Analysis is a technique of analysis of historical data to estimate the long-term route of market movements. Thus, through this method, investors can try to predict whether a sector that’s expanding will continue to grow or not.
Trend Analysis involves analyzing extensive data. In short, Trend Analysis helps in comparing the performance of a firm in order to provide investors with an idea of whether the business will move forward or backward. Trend Analysis is also known as Horizontal Analysis.
Stock Trend Analysis is significant for one important reason, which is that it can help provide investors with suggestions on how they can reinforce things in order to move their business forward. However, note that there is no guarantee in relation to the accuracy of the predictions.
Once investors understand what trend analysis is, it is imperative that they explore some of the various strategies involved.
Trend Direction vs Trend Strength
You have to carefully determine the trend direction rather than the trend strength when undertaking technical analysis. Here’s looking at both these aspects in more detail below:
Trend Direction (Which Way)
- Trendlines: Connect a minimum of two or three consecutive higher lows for uptrends or lower highs for downtrends on the chart.
- Moving Averages (MA): You can use exponential or simple moving averages, i.e. 50-day or 200-day in this case. If the price is above the MA and the MA is trending upwards, the trend remains bullish. If the points below are met, then it is bearish or downwards.
- Chart Patterns: Identify specific patterns like the head and shoulders, triangles, and double tops to anticipate continuation or reversals.
Trend Strength (How Strong)
- Average Directional Index (ADX): It is a vital technical indicator for assessing trend strength, independent of the direction. For example, if the ADX < 20, it indicates a sideways or weak trend. If ADX < 25, it indicates a robust trend; if ADX < 40-50, it indicates an extremely robust trend.
- RSI (Relative Strength Index): This measures the velocity of price movement for identifying overbought (< 70) or oversold (<30) conditions.
- Volume Analysis: A robust trend is validated by higher trading volumes. A weak trend, on the other hand, often displays lower or reducing volumes.
- Slope of Trendline: A steeper slope indicates a stronger, faster trend, along with higher reversal risk.
Primary, Secondary, and Minor Trends
Trend analysis involves the evaluation of historical prices, technical indicators, and volume to identify the market direction, i.e., whether up, down, or sideways. According to Dow Theory, trends are classified by duration. These include the following:
Primary Trend (Tide)
- The market's long-term direction may persist for a few months or even years (1+ years). It is the main driver of wealth generation.
- The phases include accumulation (smart buys at low prices/panic), public participation (the general public joins and prices rise on high volume), and distribution/excess (late buyers enter and savvy investors sell).
- The analysis methods include the 200-day Moving Average (DMA), where the primary trend is taken as bullish if the price is above this line. Another method is Higher Highs/Higher Lows (sustained pattern of rising troughs or peaks).
Secondary Trend (Waves)
- A counter-trend movement or correction that may last for weeks or even months. It moves in the opposite direction of the primary trend.
- Serves as a healthy reset, absorbing gains and losses and often correcting the market by around 10-20%.
- The analysis methods include the 50-day moving average (swing traders use this to identify immediate reversals) and support and resistance levels (which help identify where the decline stops and where the primary market trend resumes).
Minor Trend (Ripples)
- These are short-term fluctuations that may last from a few days to a few weeks.
- Day and swing traders usually use them to earn swift profits.
- The analysis methods include intraday charts (15-minute or hourly) to track 5- and 10-day moving averages.
- They are also significantly affected by policy announcements, sector news, updates, and specific earnings reports.
Support and Resistance in Trend Confirmation
When it comes to trend analysis and confirmation, you should note the support and resistance levels.
Support (floor) are zones where demand increases, thereby arresting declines in prices. Investors often seek buying opportunities near these levels.
Resistance (ceiling) indicates zones where supply exceeds demand, thereby preventing price surges. These are levels where the selling pressure gradually turns intense.
Role Reversal is a key concept where broken resistance sometimes becomes support in an uptrend, while broken support becomes resistance in a downtrend.
Traders in India often focus on round numbers in this case, i.e. ₹500 or ₹1000, with robust psychological support or resistance zones.
A trend is confirmed only when prices consistently make new highs or lows after these zones are tested.
Any decisive movement above a robust resistance level will confirm a continuation of the uptrend (breakout), while a drop below a solid support level confirms the downtrend (breakdown).
Analysts often leverage multiple timeframes, such as long-term charts (monthly/weekly) and short-term charts (hourly/daily), to identify immediate resistance/support for entry/exit.
How to Identify a Trend on Charts
Identifying a trend means looking for consistent, consecutive price movements over a certain period. Here’s what you need to know in this regard:
- Uptrend: You’ll find a series of higher highs and higher lows.
- Downtrend: This is characterised by a series of lower highs and lower lows.
- Sideways Trend: The price will move within a horizontal range, with the peaks and troughs at about the same levels.
- Trendlines: They connect a minimum of two or three lows (for uptrends) or highs (for downtrends). This helps determine the slope and direction. A steeper angle indicates a trend that is less reliable.
Here are the steps that you can follow in this case:
- Choose a security for analysis
- Gather and plot data (use line, candlestick or bar charts on your platform) to visualise the price movements
- Confirm with indicators like MACD or RSI
- Track the timeframe where longer durations (weekly/monthly) may offer more dependable trends as compared to daily charts
Here are some trend identification chart examples that will give you a better idea:
- Line Charts with Trendlines: Imagine a Trendline linking the bottom of a rising stock to identify an uptrend.
- Moving Average Crossovers: Utilise a 9-day and 21-day EMA (Exponential Moving Average) to signal trend changes. A short-term moving average crossing over a long-term one will indicate a possible upward trend.
- Candlestick Patterns: You can use charts to identify patterns like Head and Shoulders or Double Tops (may indicate a trend reversal).
- Parabolic SAR: Dots appearing above/below price bars on charts help define current trend direction and possible reversal points.
- Volume Analysis Chart: A bar chart at the bottom of the price chart, where rising volume during the uptrend confirms robust buying pressure in the market.
- Stock Sector Trends: You may track sector-specific movements, such as the surge in pharma stocks during the pandemic. Another example is the sideways movement of bank stocks.
How Volume Confirms a Trend
This is how volume confirms a trend -
- Validating trends (price up, volume up)
In any healthy uptrend, a rising price backed by high volume indicates greater investor conviction and institutional buying. This suggests a likely continuation of the trend. - Confirmation of downtrends (Volume up, price down)
In any downtrend, high volume on down days and lighter volume on bounces indicate robust selling pressure (driven by fear or greed). It confirms a strong downward trend accordingly. - Validation of breakouts
A price breaking above a resistance level on high volume will confirm a strong breakout. Alternatively, a breakout on low volume is often a trap or false move. - Reversal Signals (Divergence)
Any sudden or considerable volume spike at the close of an extended trend may signal exhaustion. This may indicate a reversal of the trend. - Low Volume Warning
A rising market with low trading volumes may indicate a lack of conviction. This may suggest a higher probability of a sudden reversal or a correction in the market.
High volumes usually indicate greater institutional investor (smart money) participation, while low volumes may suggest retail participation. Volume spikes often precede major price movements, enabling traders to anticipate momentum shifts. Trading on days with low volume is always riskier, since it does not confirm the market direction.
Trend Reversals vs Pullbacks
Here are the main differences between trend reversals and pullbacks.
- Depth and Duration: Pullbacks are low-volume and short-term dips, while reversals are long-term and high-volume shifts that break earlier Trendlines.
- Context of Trend: Pullbacks usually happen within a trend, i.e. a dip in an uptrend. Reversals, on the other hand, indicate the end of one trend and the beginning of another.
- Market Sentiments: Pullbacks are typically seen as healthy profit-taking, while reversals signal major shifts in sentiment.
Moving Averages, ADX, MACD, RSI, OBV in Trend Analysis
Some of the vital trend analysis indicators in India include:
Moving Average (MA)
This is used to identify the trend direction through smoothing price data. Short-term traders may use 9- and 21-day EMAs (Exponential Moving Averages), while long-term investors may focus on the 200-day SMA (Simple Moving Average) to identify major trend shifts. A bullish trend may be visible when the price is above the 50-EMA and a shorter MA crosses above a longer MA (for instance, the 50 DMA crosses above the 200 DMA).
MACD (Moving Average Convergence Divergence)
This momentum-trend indicator is vital for identifying reversals. The components include MACD line (12 EMA-26 EMA), Signal line (9 EMA of MACD) and Histogram. The signal is bullish when the MACD line crosses above the Signal line (a crossover) and the MACD is above 0.
Average Directional Index (ADX)
This helps measure the strength of a trend, irrespective of its direction. ADX above 25 will indicate a robust trend, while ADX below 20 indicates a sideways or weak market. It is used to bypass whipsaws or false signals across ranging markets.
RSI (Relative Strength Index)
It helps measure the change and speed of price movements to identify oversold/overbought conditions. An RSI reading above 70 indicates an overbought market (possible correction/reversal) while anything below 30 indicates an oversold market (possible buying opportunity).
On-Balance Volume (OBV)
Volume is used to confirm price action. If the price rises while OBV falls, it indicates weaker buying pressure (a potential reversal). A rising OBV is the confirmation of an uptrend.
Example of Higher Highs / Higher Lows
Let’s take an example that will help you understand higher highs/higher lows. Let’s assume there is a bullish stock of a reputable company you are observing.
- Initial Move: The stock goes up from ₹200 to ₹220 (High 1)
- First Correction: It will pull back to ₹210 (Higher Low 1- above the original ₹200)
- Second Move: It surges once again, breaking the old high and touching ₹235 (Higher High 2- above ₹220)
- Second Correction: It pulls back to ₹225 (Higher Low 2- above the earlier ₹210)
This means the stock is consistently forming higher troughs and peaks while in a solid uptrend. Several PSU (public sector undertaking) stocks saw this structure throughout 2023, in which every temporary dip (a higher low) was followed by a new high (a higher high).
Example of ADX Showing Strong vs Weak Trends
The ADX (Average Directional Index) measures trend strength (0-100) regardless of direction. Here’s what it signals:
- ADX <20: Weak/Sideways (follow range-bound strategies and skip trend-following)
- ADX 20-25: Possible Trend Formation (Watch for the breakout)
- ADX 25-50: Robust Trend (trend-following may be feasible)
- ADX > 50: Very Strong/Overextended Trend (possibility of correction or trend reversal)
Example Where Price Breaks Resistance, but Volume Does Not Confirm
Here is an example in which the price breaks resistance, but the volume does not confirm. This is often known as a False Breakout or Bull Trap.
One such case occurred early in 2023 when the Nifty 50 index neared the vital 18,600 level. This worked as a robust ceiling, with the index attempting to break above it several times. On several occasions, the Nifty 50 pierced the 18,600 level during intraday trading sessions.
Yet these intraday spikes occurred without major volume participation, and trading volumes did not show the sustained, high surge needed to support a lasting upward movement. Hence, without big-money buying, the index could not sustain this break and fell back below 18,600 again, trapping the traders who purchased on the initial breakout.
So, this is what a no-volume breakout usually looks like:
- Low/average volume: The breakout candle has volume similar to/lower than the previous few days, rather than a considerable spike.
- Long wicks: The price moves above the resistance level and closes near or below it, forming a long upper wick and indicating selling pressure.
- Low intensity: The price moves upward slowly rather than aggressively or sharply.
Trend Analysis Checklist
Here is a trend analysis checklist that you will find useful:
|
Step |
What to Do |
|
Data Gathering & Preparation |
|
|
Technical Trend Identification |
|
|
Momentum & Volatility Indicators |
|
|
Fundamentals & Context |
|
|
Strategy Execution & Risk Management |
|
Your Take
Experts believe that traders should use a combination of Trend Analysis Methods to develop their own strategies. Individuals would be able to clearly identify the entry and exit points as a result of this.
Happy Investing!
|
You May Also Be Interested to Know |
|
|
1. |
|
|
2. |
|
|
3. |
|
|
4. |
|
|
5. |
How to Buy Stocks Online in India? |
Disclaimer: This blog is solely for educational purposes. The securities/investments quoted here are not recommendatory.