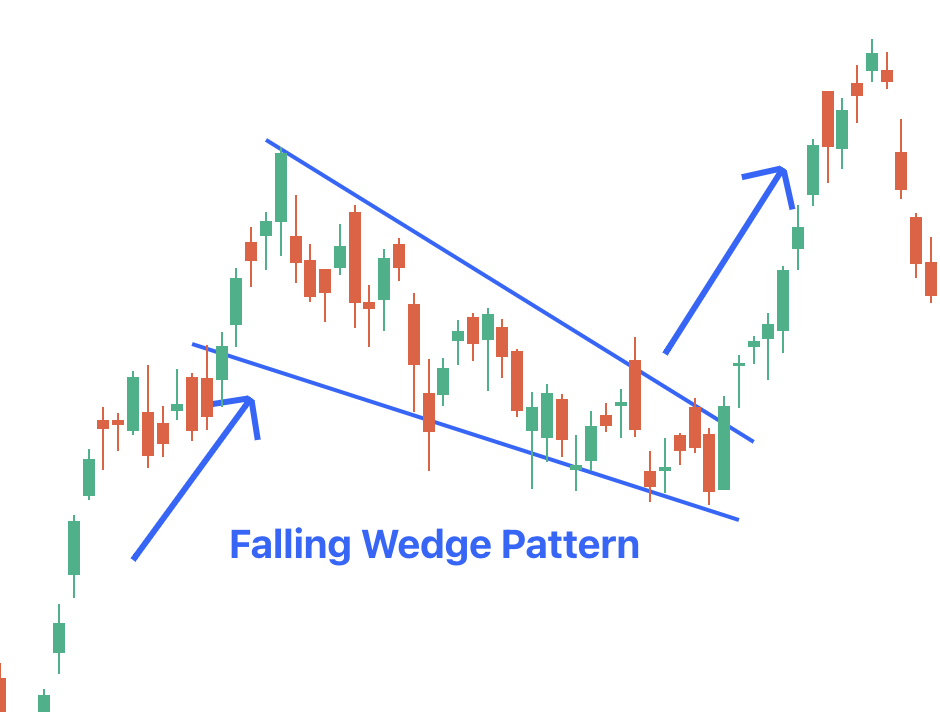
Falling Wedge Pattern
Candlestick charts are one of the most popular ways to study the price of an asset. By studying candlestick charts, traders can identify certain patterns which can help gauge future price movements. The falling wedge is one such pattern that could be a vital indicator of the possible price trajectory.

What is a Falling Wedge Chart Pattern?
The wedge pattern is commonly considered a reversal pattern but can, in some cases, indicate the continuation of a trend.
The falling wedge pattern is a bullish reversal pattern in which two trend lines converge, indicating a narrower range of price movements. This pattern occurs when the price is in an uptrend but faces a temporary loss in momentum. A breakout from the pattern results in a further up-move in price.
Features of Falling Wedge Pattern
The falling wedge candlestick pattern is a great indicator to identify reversals or trend continuation. The pattern occurs when the price of the asset is in a clear uptrend but faces some resistance. The falling wedge pattern has three common characteristics.
- A change in price action: The price of the asset temporarily trades in a downtrend after trending upwards. As a result, the price creates lower lows and lower highs.
- Converging trend lines: The pattern has two converging trend lines. One trend line tracks the highs of the price while the other tracks the lows. As a result, the range of the price movement narrows.
- Decrease in volume: As the trend lines converge, a decrease in the volume is witnessed.
The pattern is seen when buyers lose momentum and the price trends downwards. However, the converging trend lines and a fall in momentum indicate that the selling pressure is not strong enough, indicating the end of the consolidation or correction phase. As a result, a breakout from the top trend line will reverse the short-term trend.
Importance of Falling Wedge Chart Patterns
Knowing how to identify a falling wedge chart pattern can be extremely helpful for the following reasons:
- The pattern indicates the end of the consolidation or correction phase. A breakout from the top trend line can push the price upwards to resume the previous uptrend.
- The pattern can be used to make fresh entries or build positions. Additionally, the pattern can help traders identify good entry and exit points.
Interpretation of Falling Wedge Candlestick Patterns
The falling wedge pattern indicates the end of a correction or consolidation phase. The pattern occurs after an uptrend in the price of an asset. Towards the end of an uptrend, buyers tend to lose momentum which draws in selling pressure.
However, if the selling pressure is not strong enough, the price will not see a significant decrease. The falling wedge pattern is an indication of such a situation. Along with the narrower trading range, traders also look at the volumes.
A decrease in the volumes, despite trending downwards, signifies that the selling pressure is fizzling out, which draws in buyers. Once the price breaks the top trend line with volumes, it is an indication that the bears have been pushed out and the previous uptrend will resume.
Traders can trade the falling wedge pattern by entering as soon as a candle closes above the falling wedge pattern with high volumes. An entry can also be made on a pullback when the price retests the top trend line of the wedge. However, a subsequent close of the candle within the wedge invalidates the pattern.