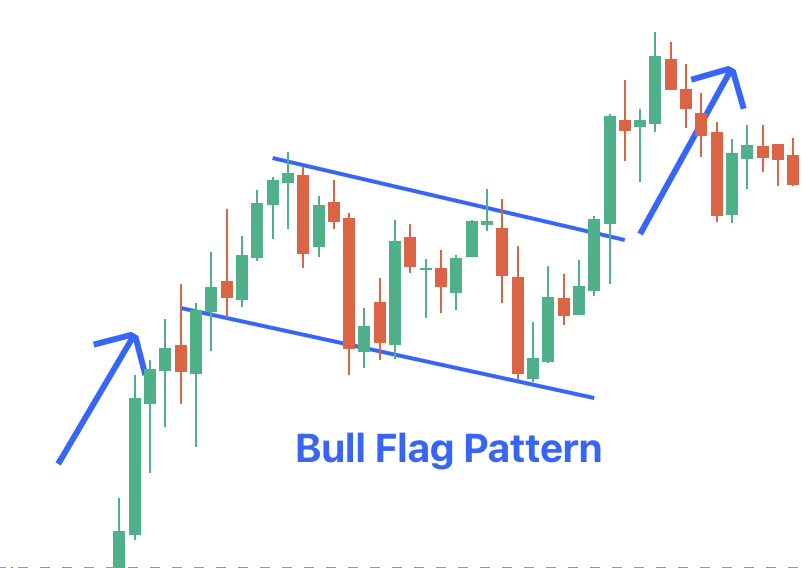
Bull Flag Pattern
A flag pattern is a price pattern in technical analysis that moves in the opposite direction of the overall trend for a short time. It’s called a flag because it looks like a flag on a flagpole.
A Bullish or Bull Flag pattern is like a brief pause in the rising price of the stock. Imagine the price is on a roll, then it takes a short breather, moving sideways in a little rectangle. This pattern is an invitation for investors to enter into a stock that is poised to resume its upward journey.
In this article, we have covered all the important details on the bull flag pattern of candlestick and how to identify and use this pattern in trading.

Bull Flag Pattern Meaning
A Bull Flag Pattern shows up in stocks that are going up strongly and suggests that the price will continue rising. They’re called bull flags because they look like a flag on a pole: the pole is the big upward jump in the stock price, and the flag is the time when the price levels off. The flag can be a flat rectangle or slightly tilted downward.
Also Read : What is a Bear Flag Candle Pattern?
How to Identify a Bull Flag Chart Pattern?
A bullish flag looks like a flag on a pole. It has three parts:
- The pole is the sharp rise in price.
- The flag is where the price moves sideways or slightly downward, creating a rectangular shape.
- The breakout happens when the price moves above the top line of the rectangle.
To be a bullish flag, it must have:
- A steep, sharp price increase (flagpole) before the flag forms.
A brief sideways or slightly downward price movement, forming a small rectangle or parallelogram (the flag) with lower volume.
- The price must break out upward from the flag, ideally on higher volume, signalling a continuation of the uptrend.
- The flag phase is short, typically lasting a few days to a few weeks.
This pattern suggests the uptrend will continue after a brief pause.
How to use Bull Flag Candlestick Pattern in Trading?
Here's how you can trade with a Bull Flag Pattern:
- Entry: Buy at the closing price of the breakout candle.
- Stop Loss: Set below the flag’s body. A price move within this range means the pattern might be invalid.
- Take Profit: Calculate the price change from the flagpole’s base to its peak, then add this to the breakout point.
For risk-tolerant traders, entering right after the breakout may be preferable. Waiting for additional confirmation might change entry, stop-loss, and take-profit levels.
What does a Bullish Flag Chart Pattern indicate?
A Bullish Flag pattern shows:
- Short Break: It indicates the price is consolidating after a sharp increase in price (the flagpole).
- Strong Uptrend: It demonstrates that the price will continue to rise since the buyers are only taking a break.
- Possible Price Jump: It implies that the price may increase again once the pause has been completed.
- Buying Chance: This is seen as a good place to enter a long position, most often waiting for the price to break above the top of the flag.
- Price Goal: Traders might forecast the next level of the price by comparing the height of the flagpole to the breakout point.
Advantages and Disadvantages of Bull Flag Candlestick Pattern
The table below shows the advantages and disadvantages of bull flag chart pattern or candlestick pattern:
|
Bull Flag Chart Pattern |
|
|
Advantages |
Disadvantages |
|
Easy to Spot: The bullish flag pattern is straightforward to identify on a chart. |
False Breakouts: On shorter timeframes, the pattern might show misleading bullish breakouts. |
|
Clear Entry and Exit Points: It is simpler to determine when to enter and exit trades with this pattern compared to others. |
Formation Time: The pattern can take a long time to complete. |
|
Found in All Markets: Bullish flags can appear in any market. |
|
How Reliable is a Bull Flag Pattern?
Bull flag patterns are very reliable for continuing trends. They show a good opportunity to join a trend that is expected to keep going. These patterns look similar each time they appear and often show up during the same kinds of trends.