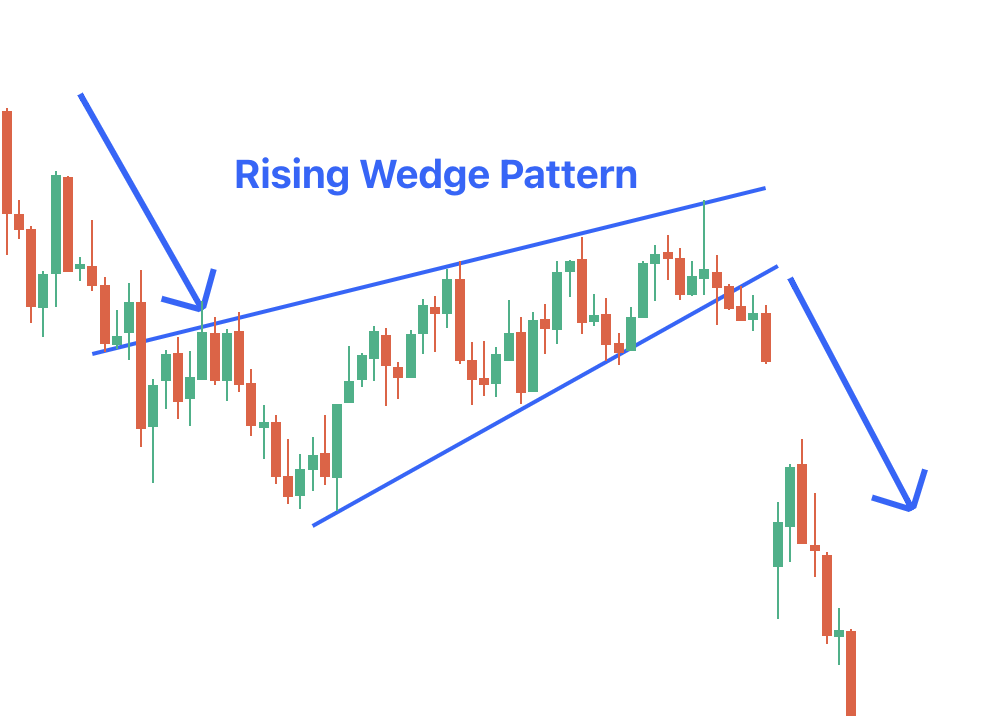
Rising Wedge Pattern
A rising wedge pattern is a bearish pattern that is formed towards the end of an uptrend. Traders can easily find this pattern on a price chart as it is easy to spot and requires a large formation. A rising wedge pattern forms in between two upward-sloping trend lines that converge as the price moves.
Here, we will discuss what a rising wedge is, the psychology behind its formation and a trading setup using the rising wedge pattern.

What is the Rising Wedge Pattern?
A rising wedge pattern is a bearish trend reversal pattern, which is formed between two upward sloping trend lines that get steeper with time. The price hovers between these two trendlines, making higher highs, but eventually, the buying pressure exhausts, and the price starts losing momentum. Generally, the price will break down, which potentially signals a trend shift.
Traders often sell the stock after seeing a rising wedge, which is considered a bearish pattern. The pattern suggests that the buying in the underlying stock is slowing down, and declining volume further increases the likelihood of price breaking down.
Characteristics of Rising Wedge Chart Pattern
Here are some key characteristics of the rising wedge candlestick pattern
- Support and Resistance
These two lines are positioned in an upward sloping angle as the price trades between it taking support/resistance.
- Volume
Volume can be observed declining as the pattern continues. This shows that the buyers are getting weaker.
- Breakdown
A breakdown in the rising wedge pattern occurs when a candle closes below the support trendline. This marks the potential trend shift in the underlying stock.
Formation of Rising Wedge Pattern
The rising wedge chart pattern forms when there is an uptrend in the underlying stock. At first, the stock seems to be going up and buyers are in control but their resolve weakens over time as the support and resistance trend lines get steeper.
Volume starts to dry up as buyers are unable to push the price higher. This is when sellers take control and the price breaks down signaling a potential change in the sentiment from bullish to bearish.
Now that you know about the rising wedge candlestick pattern, let us talk about how to use it on a price chart.
How to Trade Using the Rising Wedge Candlestick Pattern?
When the rising wedge forms on a chart, you will notice that the price is an uptrend. Both the support and resistance trend lines will get steeper over time. You will also notice that the price gets rejected whenever it touches the upper resistance line. The wicks start indicating the slowing down of buying pressure. This is where the sellers are entering the stock. As mentioned earlier, the volume in the stock may also start drying up.
When a red candle closes below the support trendline, you can short the market by keeping a stop loss just above the break down candle and keeping your risk to reward ratio at least 1:2.
Conclusion
The rising wedge pattern is a powerful technical tool commonly used for identifying potential trend shifts in the market. Understanding the psychology behind, its characteristics and trading setup, you can increase your chances of making profitable trades.
Remember to always use additional technical indicators and backtest your strategies before trading in the market.