Best Intraday Trading Indicators: Bollinger Bands, Moving Averages, MACD

Intraday Trading Indicators
Intraday trading or day trading involves buying and selling shares within the same trading day. Booking profits in intraday trading requires quick decision-making and precise market analysis. Traders must understand short-term market behaviour to identify entry and exit points.
Here, trading indicators prove to be of great help. To know how, read the blog till the end, as we discuss some of the most popular intraday trading indicators and how they can help you make better trading decisions.
What are Intraday Trading Indicators?
Intraday Trading Indicators help analyse trends, measure momentum, and gauge market volatility. Traders can use these indicators to decide the best times to enter or exit a trade during the day.
Best Intraday Trading Indicators
Bollinger Bands
Developed by John Bollinger in the 1980s, Bollinger Bands is a volatility-based indicator that helps traders analyse whether the market is overbought or oversold and predict possible price movements.
Let’s say the Bank Nifty opened yesterday at 36,000. But today, it’s 500 points down, i.e., 35,500. This means the market has deviated. Bollinger Bands help identify this deviation.
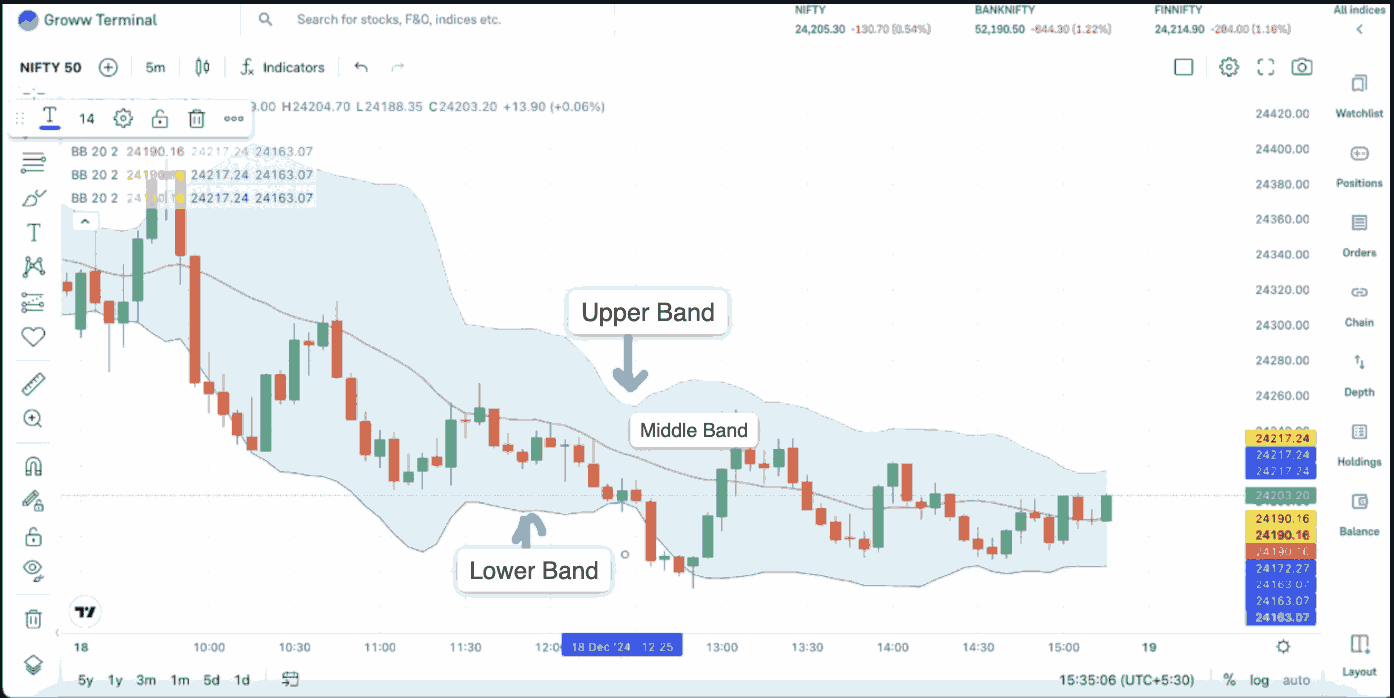
Bollinger bands consist of three lines plotted on a price chart (as shown in the image above). The default settings for these lines are set to 20-period and 2 standard deviations.
- Middle Band: This is the average price of the stock over a set time, usually 20 days or 20-period.
- Upper Band: Calculated by adding two standard deviations to the middle band.
- Lower Band: Calculated by subtracting two standard deviations from the middle band.
The space between the upper and lower bands shows the volatility level of the market. When the bands are far apart, the market is more volatile. When they are close together, the market is less volatile.
Also, the upper and lower bands can be used to analyse overbought and oversold conditions. Here’s how!
- If the price is close to the upper band, the stock might be overbought (priced too high). This could be a signal to sell.
- If the price is close to the lower band, the stock might be oversold (priced too low). This could be a signal to buy.
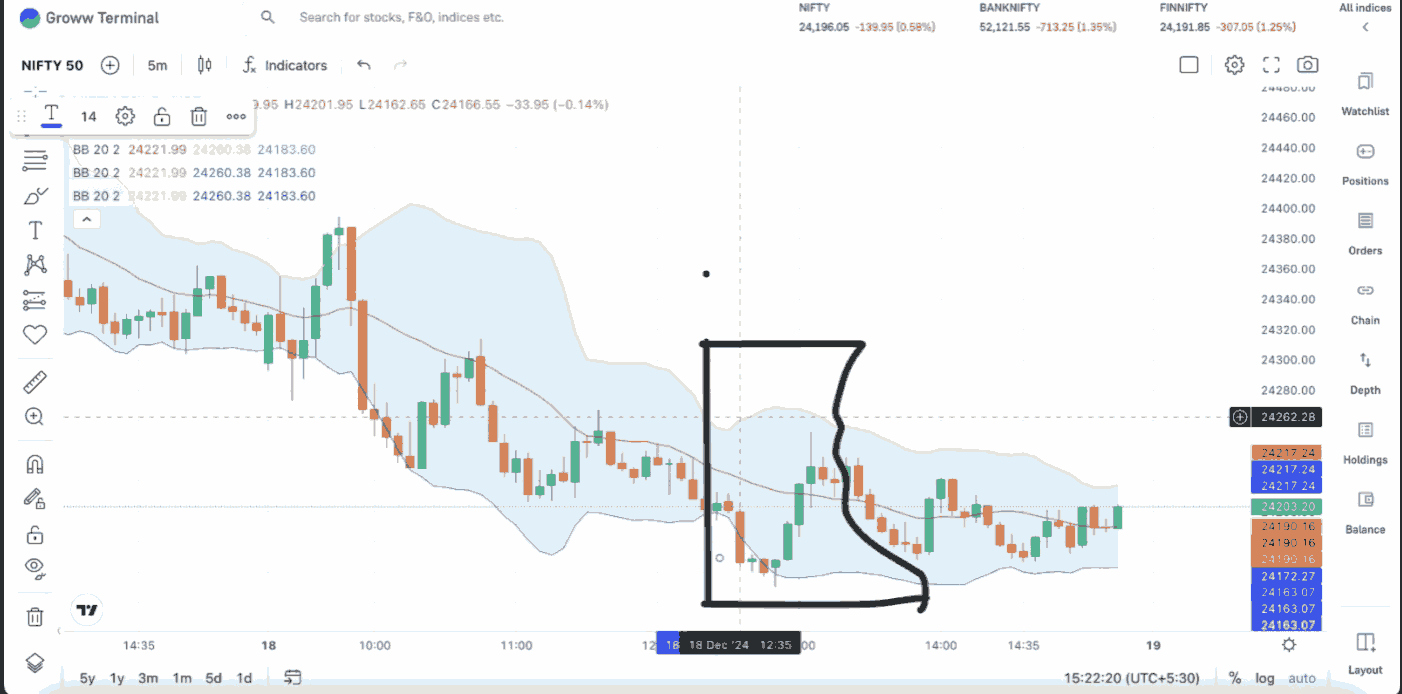
In the graph, you can see a bearish candle that breaks below the lower Bollinger Band. A breakout setup can be made here.
After hitting the lower band, the price starts moving towards the middle band. This movement signals a possible chance to buy, as the price may continue to rise or break above the middle band.
Pro Tip For Using Bollinger Bands:
- Bollinger Bands are more effective when used with other indicators like the Relative Strength Index (RSI) or Moving Average Convergence Divergence (MACD) to confirm trading signals.
- Never trade blindly according to the size of the bands. Make your strategy with a good set of rules.
Moving Averages
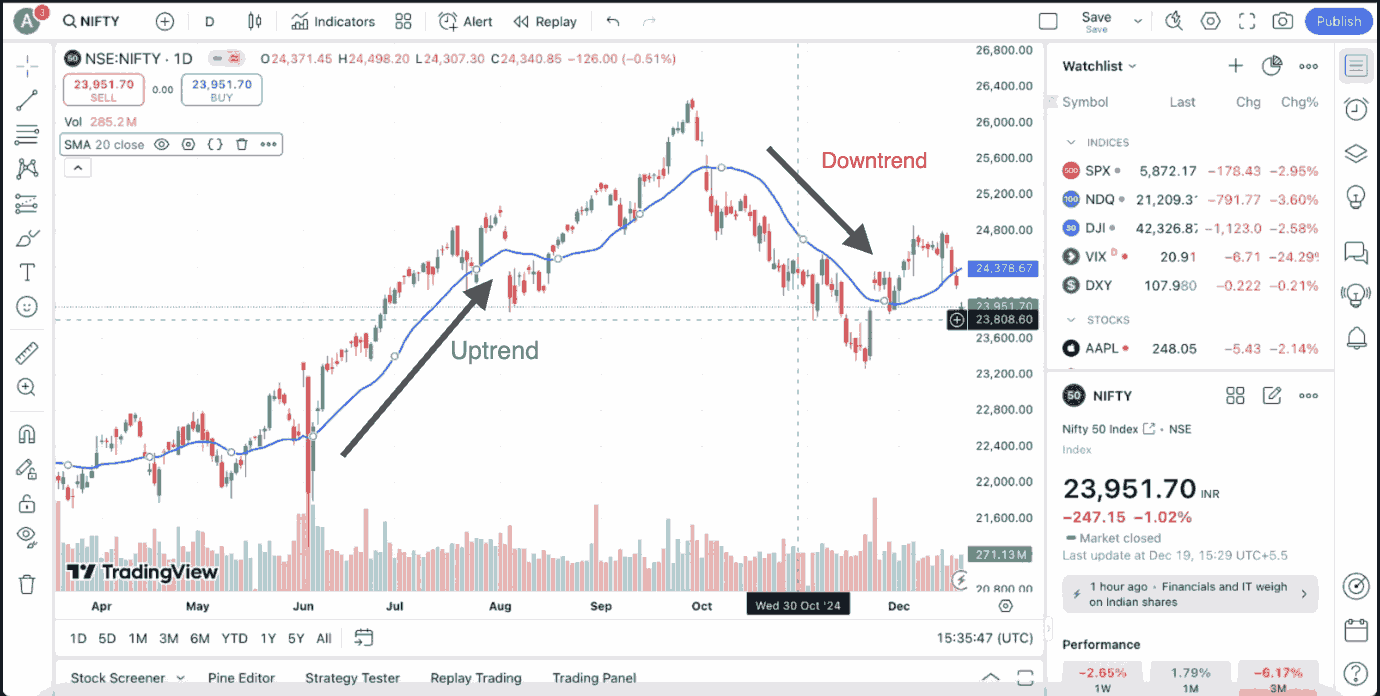
As the name suggests, the moving average calculates the average price of an asset for the last “N” number of periods. Here, “N” can be 10 days, 20 days, and so on. It smoothens out short-term market fluctuations and makes it easier to identify the
- Trends
- Trend reversal
- Areas of support and resistance.
Further, there are two main types of moving averages: Simple Moving Average (SMA) and Exponential Moving Average (EMA).
- The Simple Moving Average calculates the average of a security's closing prices over a specific period, for instance, 10 days.
Now, using an example, let’s understand how SMA is calculated.
Below’s the table for XYZ stock's 10-day price movements. We will calculate the 10-day SMA of the stock.
|
Day |
Stock Price |
|
1 |
120 |
|
2 |
100 |
|
3 |
99 |
|
4 |
130 |
|
5 |
98 |
|
6 |
111 |
|
7 |
108 |
|
8 |
102 |
|
9 |
86 |
|
10 |
122 |
Sum of Closing Prices:
|
120+100+99+130+98+111+108+102+86+122=10,761 |
Divide the sum by the number of days (10):
SMA: 1076/10=107.6
XYZ stock's average closing price over the past 10 days is 107.6. If the stock's current price is above this SMA, it suggests an upward trend, while a price below the SMA suggests a downward trend.
As the stock price moves, new data will be added, and prices from previous days will be ignored. For instance, if the 11th-day price is added, the 10-day price movement will be from the 2nd day to the 11th day.
- Exponential Moving Average (EMA)
The Exponential Moving Average (EMA) is similar to the SMA but gives more weightage or importance to current data and price points. The most commonly used EMAs are 8-day and 20-day EMAs.
The formula used for calculating EMA is:
|
Closing price x multiplier + EMA (previous day) x (1-multiplier) |
Moving Average Convergence Divergence (MACD)
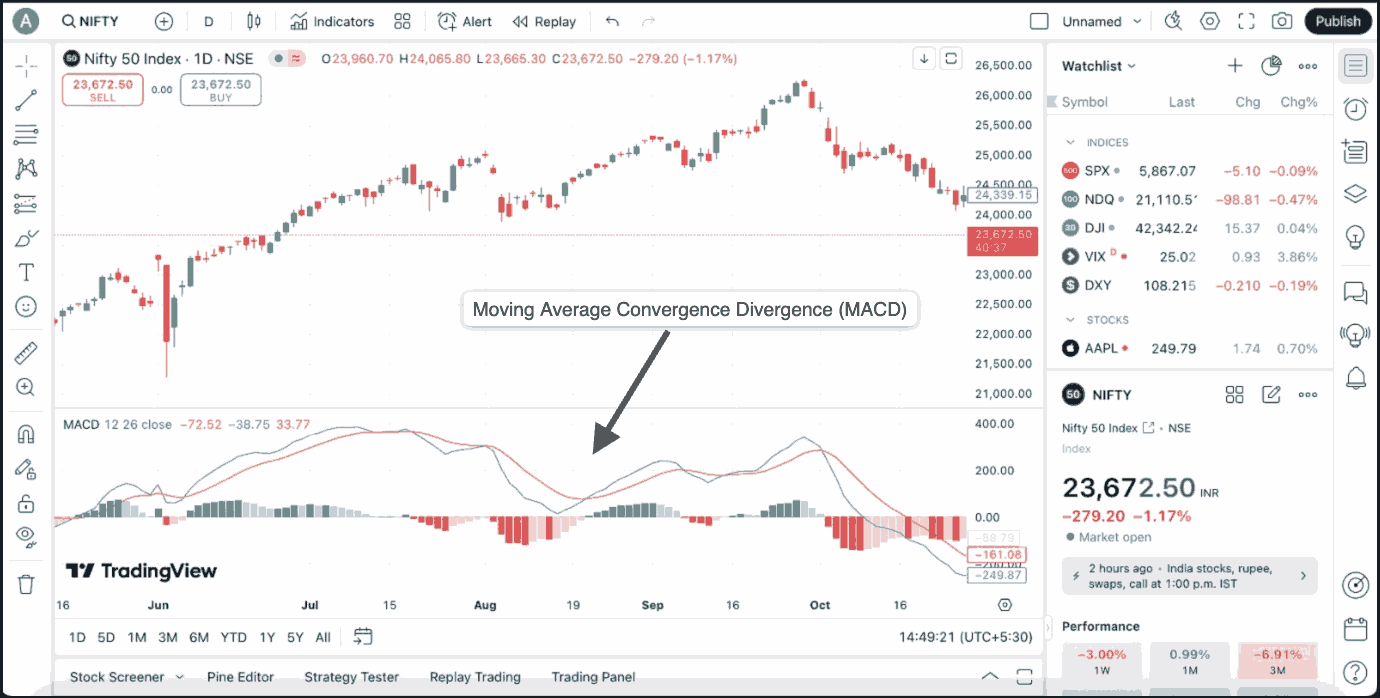
Moving average convergence/divergence (MACD) is the technical indicator that follows trends, i.e., trend-following indicator. For instance, if the market is in a downtrend, the MACD will go down, and vice versa when it is in an uptrend.
The MACD is made using a combination of three types of exponential moving averages (26EMA, 12EMA, 9EMA) and consists of four main components.
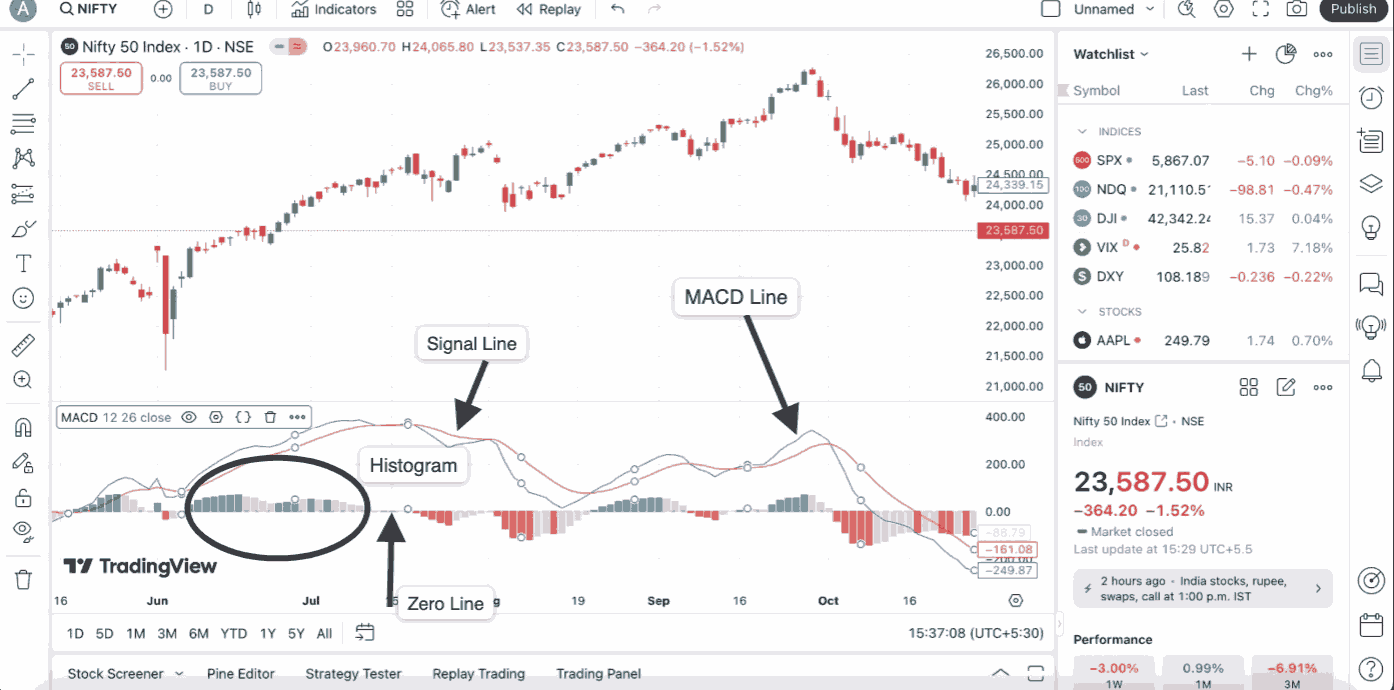
- MACD Line: This line is calculated by subtracting the 26-period Exponential Moving Average (EMA) from the 12-period EMA. It shows the difference between these two moving averages.
- Signal Line: This is the 9-period EMA of the MACD Line.
- Zero Line/Base Line: The middle line is called the zero line or baseline as it holds zero value.
- Histogram: The histogram represents the difference between the MACD Line and the Signal Line.
Here’s what the MACD indicator is primarily used for:
- To identify trends (Buy/Sell signal)
- When the MACD Line crosses above the Signal Line, it suggests a bullish trend or buy signal.
- Conversely, when the MACD Line crosses below the Signal Line, it indicates a bearish trend or sell signal.
- When the MACD Line and Signal Line cross above the baseline, it suggests a bullish trend or buy signal.
- When the MACD Line and Signal Line cross below the baseline, it indicates a bearish trend or sell signal.
- MACD Divergence
Generally, the MACD indicator moves in the direction of the stock. However, divergences occur when the stock price and the MACD indicator move in opposite directions.
- When the stock price falls, and the MACD indicator moves upward, it’s a bullish MACD divergence.
- When the stock price moves up, but the MACD indicator is in a downtrend, it’s a bearish MACD divergence.
Average Directional Index (ADX)
The Average Directional Index helps identify a trending market (either bullish or bearish) and determines the strength of the trend. The ADX Line ranges from 0 to 100.
+DI and -DI Lines:
- The Positive Directional Indicator (+DI) measures upward movement.
- The Negative Directional Indicator (-DI) measures downward movement.
- The relationship between the +DI and -DI lines helps identify the direction of the trend.
Here’s how to identify the trend strength using the Average Directional Index indicator.
- Strong Trend: When the ADX is above 25, it indicates a strong trend, regardless of the direction. The higher the ADX value, the stronger the trend.
- Weak Trend: When the ADX is below 20, it suggests a weak trend or a sideways market.
Bullish Trend: When the +DI line is above the -DI line, it indicates a bullish trend. Bearish Trend: When the -DI line is above the +DI line, it indicates a bearish trend.
Relative Strength Index (RSI)
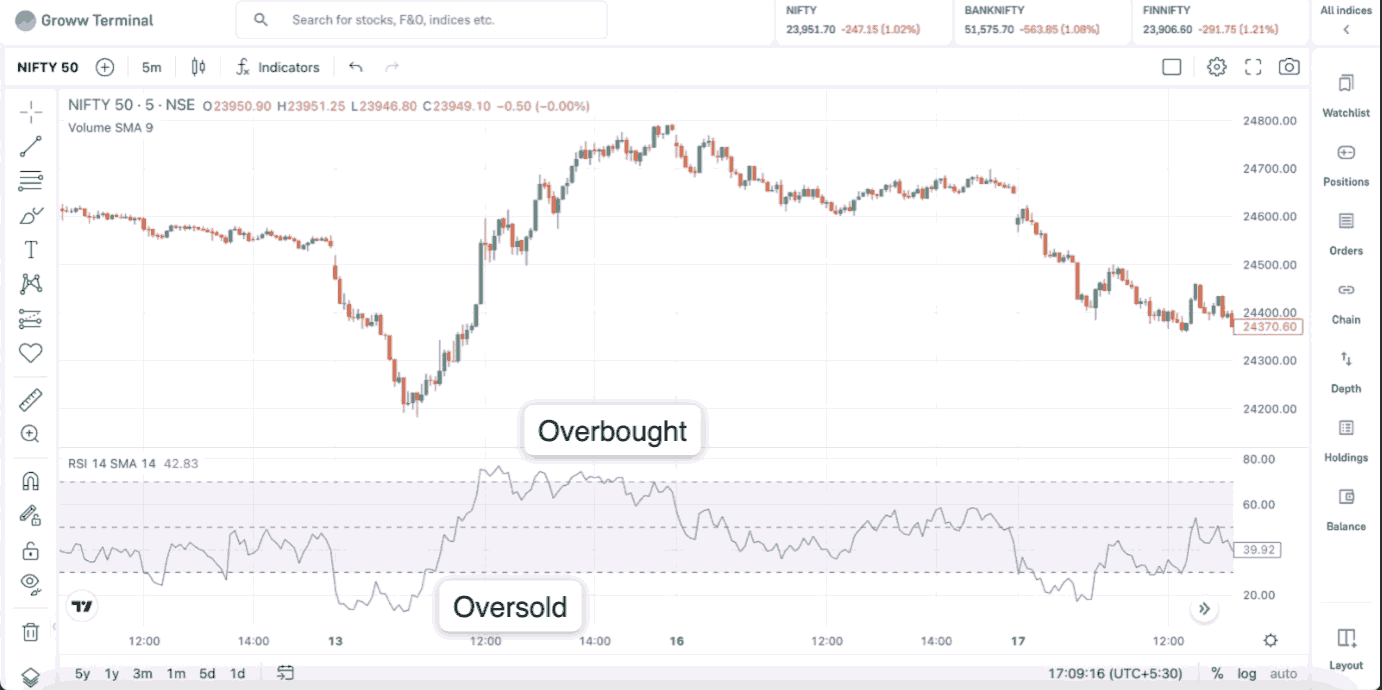
Relative Strength Index/RSI measures the speed and change of the stock’s price movements. Also known as a momentum oscillator, RSI moves back and forth, oscillating between 0 and 100.
With the RSI, traders can analyse if a stock is
- Overbought (priced too high) or
- Oversold (priced too low).
Generally, the default timeline RSI is calculated for a 14-period time frame, and it ranges from 0 to 100.
- When it is above 70, it suggests that the asset might be overbought
- When it is below 30, it indicates that the asset might be oversold
- 50 is a neutral position where it strikes a balance between bullish and bearish positions.
Stochastic Oscillator
The Stochastic Oscillator is a momentum indicator that helps traders identify overbought and oversold conditions. This intraday trading indicator compares an asset's closing price to its price range over a specified period.
It is based on the principle that during an uptrend, prices tend to close near their high, and during a downtrend, prices tend to close near their low.
The two key components of a Stochastic Oscillator include,
- %K Line: The main line that shows the current price position
- %D Line: A 3-period moving average of the %K line that smoothens out the data
The Stochastic Oscillator operates within a bounded range of 0 to 100.
- Above 80: The market is overbought.
- Below 20: The market is oversold.
- A bullish signal occurs when the %K line crosses above the %D line.
- A bearish signal occurs when the %K line crosses below the %D line.
Volume Indicator
The volume indicator reflects the level of participation or the number of buyers and sellers in the market. High trading volume indicates strong interest in the asset, while low volume may signal a lack of interest or uncertainty.
One more thing to remember is that this indicator does not show price movement; it only depicts trading activity.
Volume Weighted Adjusted Price
Volume Weighted Adjusted Price calculates the average price of an asset, weighted by its trading volume. As you can see in the image below, this indicator resembles Bollinger bands. However, its working is completely different.
Also, only the middle line is the VWAP line and you can remove the upper and lower bands in settings.
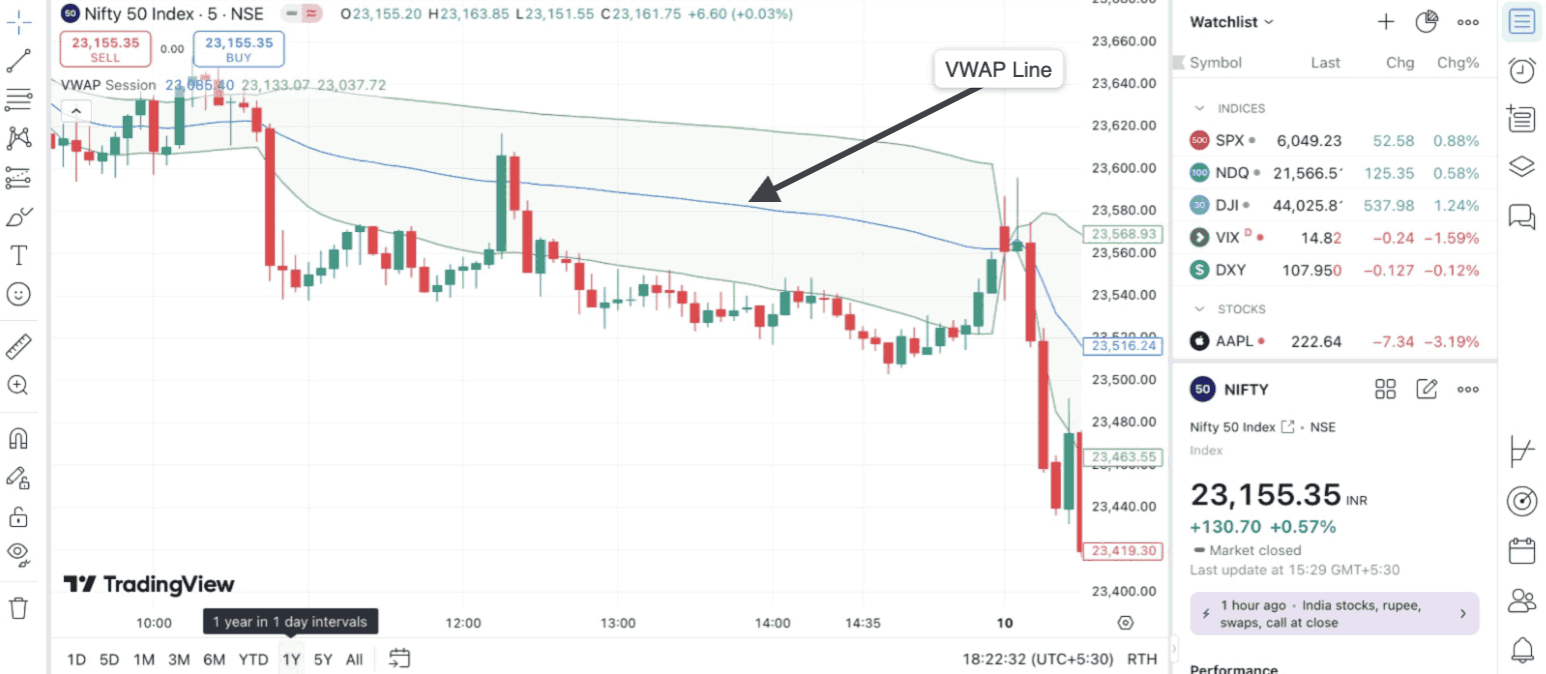
VWAP helps traders determine whether the current price of a stock is above or below its average trading value for the day.
- If the price is above VWAP, it indicates bullish sentiment
- If the price is below VWAP, it suggests bearish sentiment.
Conclusion
By using intraday trading indicators, traders can gain valuable insights into market conditions and make their strategies accordingly. However, no single indicator is foolproof, and relying solely on indicator-based trading can be a bit risky. Always remember that successful trading involves using a combination of indicators, different analysis techniques, and risk management.