DuPont Analysis: Meaning, Formula & Examples
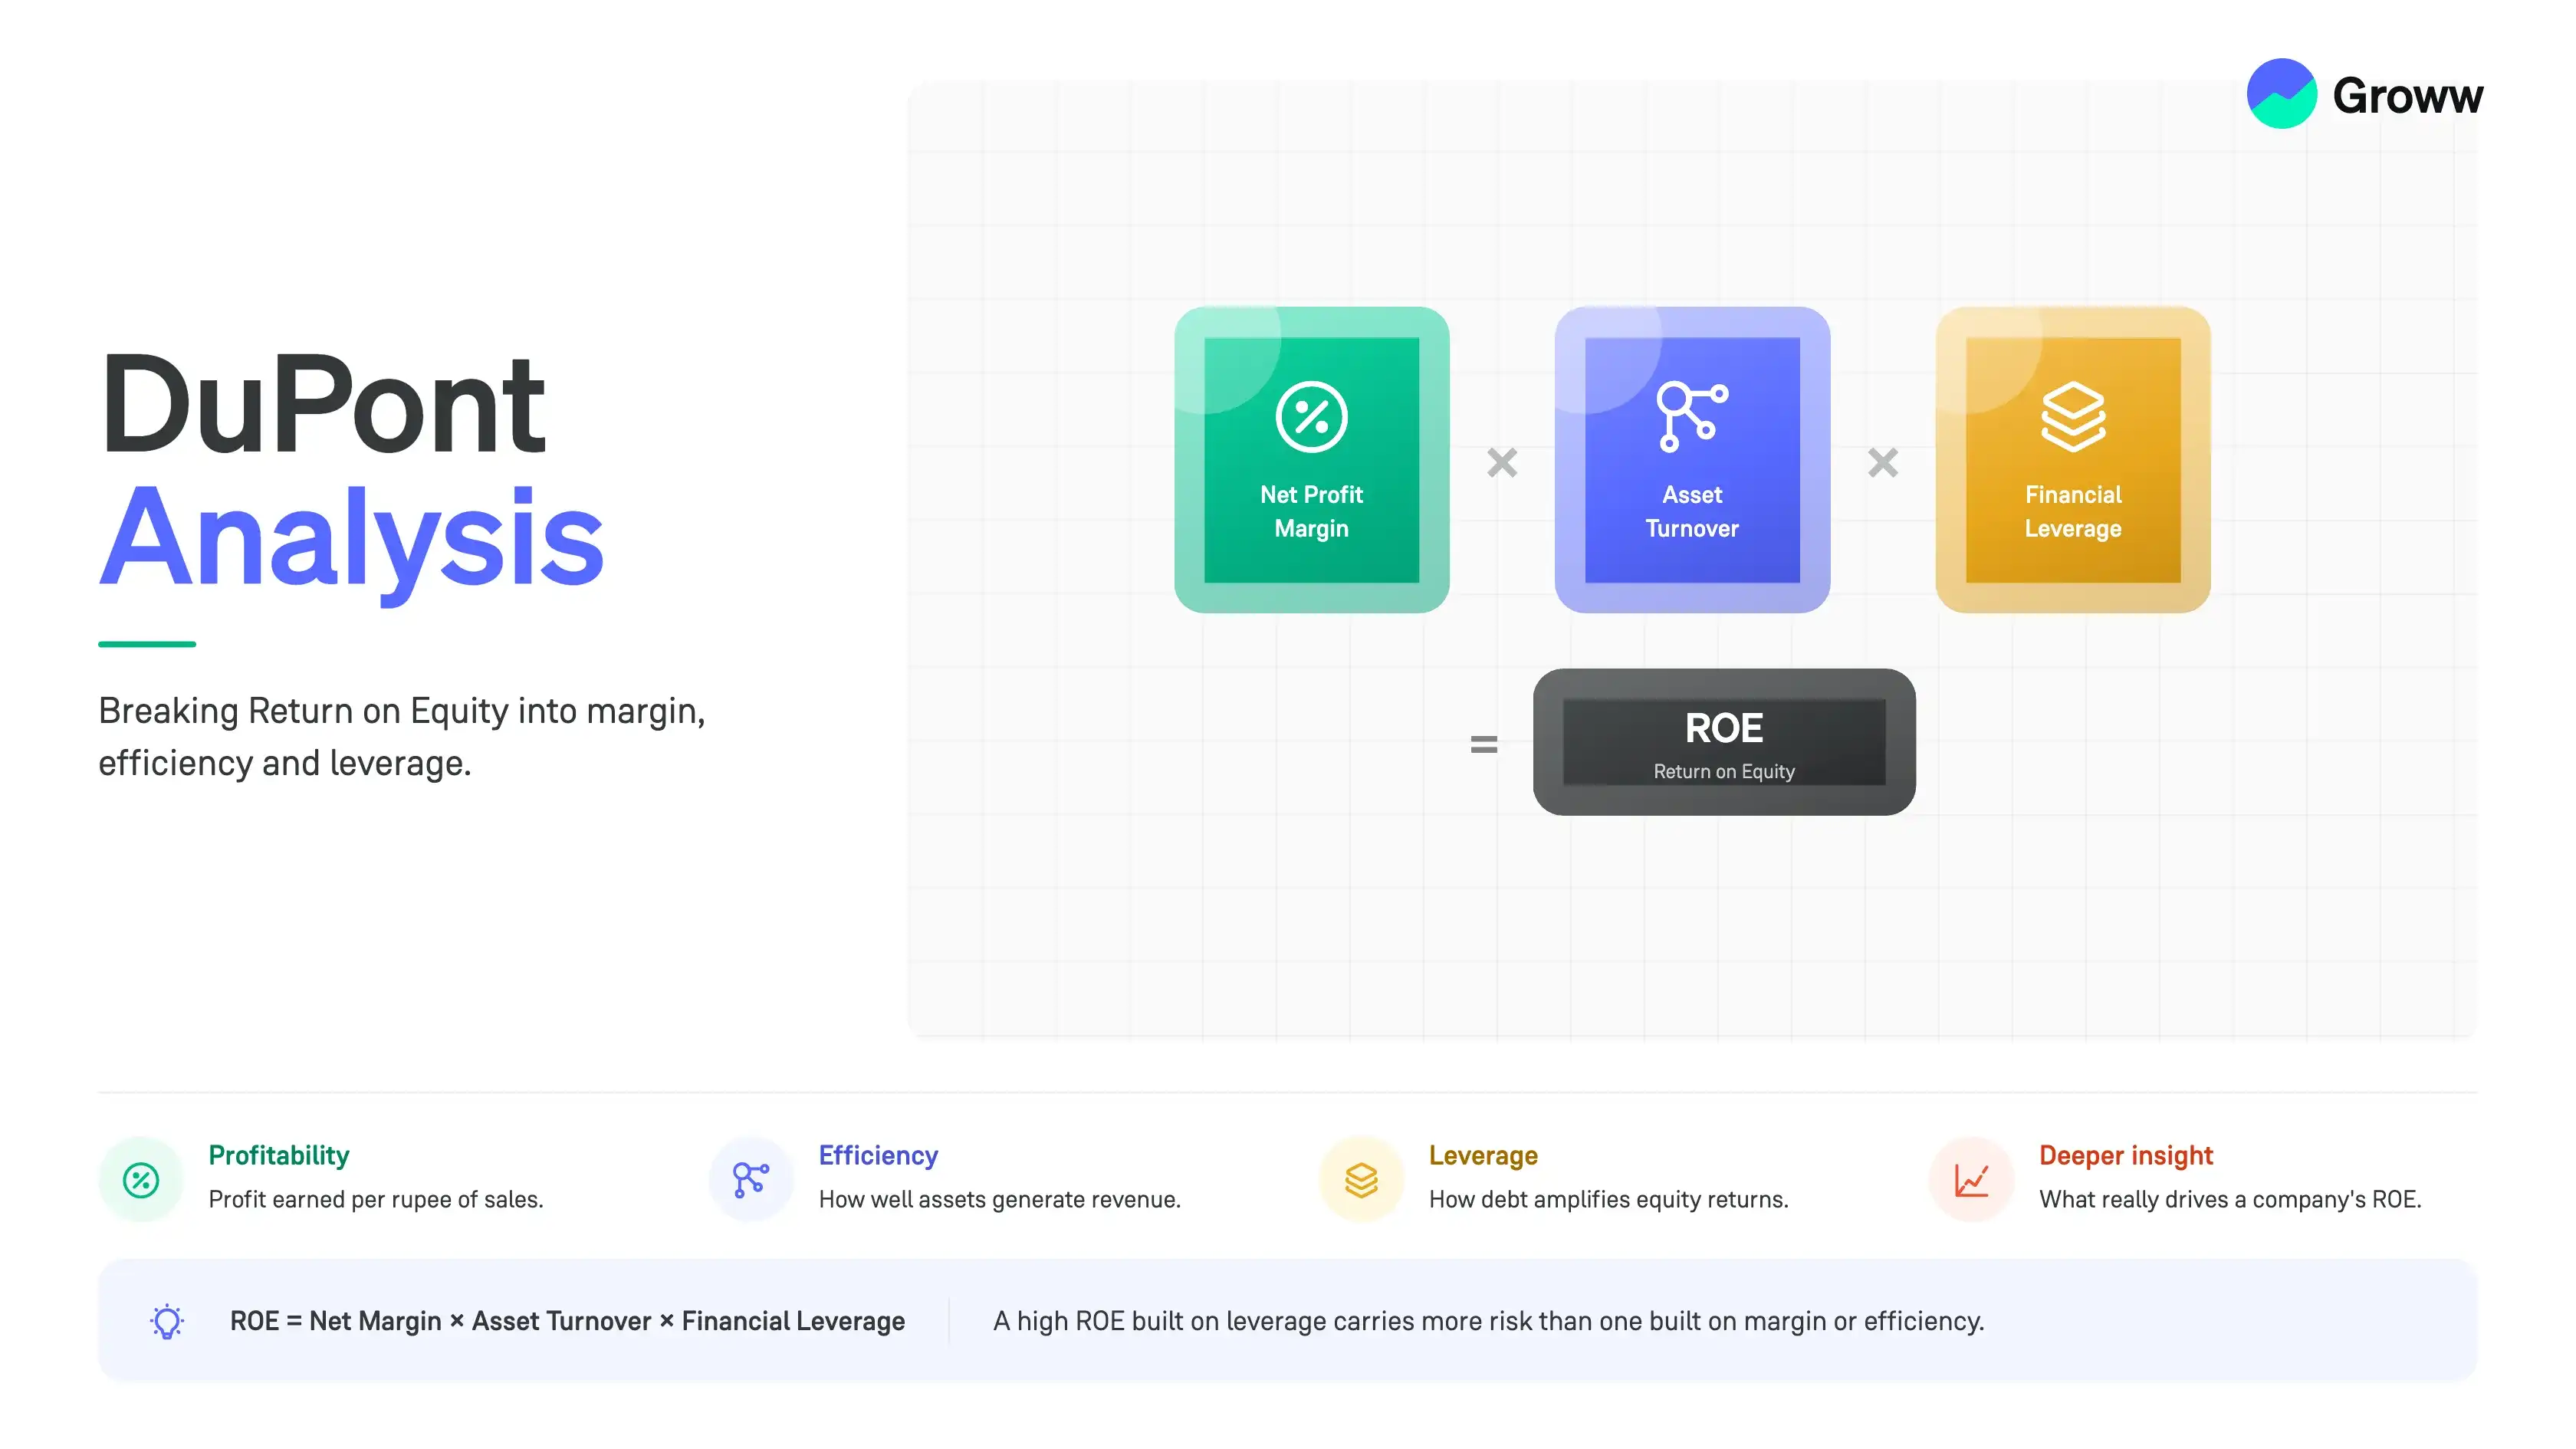


DuPont Analysis, also referred to as Return on Equity (ROE) is a measure of the profits generated in comparison to the amount of capital invested by a shareholder.
Before we delve into the technical aspects of Dupont analysis, the formula and the computation, let us learn about its origin.
Historical Background
Donaldson Brown of Dupont Corporation is credited with developing the DuPont analysis in the 1920s.
However, the motive was not towards analyzing stocks. Rather, Brown created the model to analyze the efficiency level of management in his company.
He minutely worked out a formula for return on equity with its various components. Over time, owing to the accuracy of the formula, it was adopted by equity shareholders to analyze stock performance.
What is Dupont Analysis
DuPont analysis is a kind of framework used to analyse the fundamental performance. It is majorly utilised for comparing the operational efficiency of two similar types of firms.
DuPont analysis is a helpful technique and strategy used for decomposing the different drivers of ROE.
Why DuPont Analysis Goes Deeper Than ROE
DuPont analysis can be used to identify whether ROE (Return on Equity) is driven by margins, efficiency, or leverage.
The DuPont analysis breaks down ROE into three components: operating efficiency (net profit margin), asset usage efficiency (asset turnover), and, of course, financial leverage (equity multiplier). This tells you, as an investor, whether a company's high ROE is driven by its operational performance or by risky financial engineering.
Here’s what DuPont analysis tells you that the plain ROE does not. ROE only shows you the final return percentage while concealing return sustainability and quality.
1. High ROE Source
A high ROE may also be due to large profits or excessive debt. DuPont analysis breaks this down to show you the source. It could be operating efficiency (net profit margin), which indicates whether the high ROE is driven by the company’s pricing power, low costs, or brand value. It may also be financial leverage (equity multiplier), which indicates whether the company is enhancing its ROE by taking on significant debt to buy assets (scaling up bankruptcy risks), particularly in high-interest scenarios.
2. Operational Efficiency (Asset Turnover)
A plain ROE does not indicate whether the company is efficiently generating revenue from its assets. That’s where DuPont analysis helps differentiate between companies selling high volumes (low-margin, high-turnover) and luxury brands (high-margin, low-turnover). So, in manufacturing, a low margin can be considered acceptable when asset turnover is high, for instance. The asset turnover ratio also shows how effectively the company uses its assets to generate revenue.
3. Engineered Growth & Sustainability
In the case of a rising ROE for a company, DuPont analysis will show whether it is due to higher sales (higher turnover) or simply to taking on more debt (higher leverage). What it helps you detect is whether the company is lowering its equity base through large, repeated buybacks or dividends, thereby artificially boosting the ROE denominator without real operational gains.
4. Improved Sectoral Comparison
Varying sectors have completely different ROE drivers. In the IT sector, for example, ROE is driven by high profit margins and moderate leverage, while in FMCG/retail, it is driven by high asset turnover and moderate margins. DuPont analysis helps you compare companies to their peers by explaining why one company's ROE is higher, rather than merely whether it is higher.
Three-Step DuPont formula
The formula for a three-step DuPont formula is -
ROE = Net Profit Margin x Asset Turnover x Equity Multiplier
This breaks down ROE into three key drivers to help you analyse the company’s performance in more detail. The key components include the following:
- Net Profit Margin (Profitability): Measures how much net profit is generated per rupee of revenue.
- Asset Turnover (Efficiency): Measures how efficiently a company's assets are used to generate revenue.
- Equity Multiplier (Leverage): Measures the extent to which a company finances its assets with debt.
For instance, if a company has a net profit margin of 10%, an asset turnover of 0.5 and an equity multiplier of 4, the ROE will be 10 x 0.5 x 4 = 20%.
Five-Step/Extended DuPont formula
The five-step DuPont formula breaks down ROE into five specific drivers, namely operating margin, asset turnover, tax burden, interest burden, and financial leverage. The formula is the following:
ROE = Net Income/EBT x EBT/EBIT x EBIT/Revenue x Revenue/Avg Assets x Avg Assets/Avg Equity
The key components are the following:
- Tax Burden: Measures the percentage of profits retained after paying taxes. A higher ratio will indicate a lower tax burden.
- Interest Burden: Tracks the effect of interest payments on profits, with a higher ratio equating to lower interest expenditure relative to operating income.
- Operating Margin: Measures operating efficiency, i.e., the profit generated per rupee of sales before taxes and interest.
- Asset Turnover: This measures how effectively the company uses its assets to generate revenue.
- Financial Leverage: This measures the extent to which a company uses debt to finance its assets.
Using the five-step model can be an upgrade over the 3-step model, helping isolate the portion of ROE driven by operational efficiency rather than by debt financing or tax planning. It demarcates operational performance from financing decisions. You can also track the components over time with a time-series analysis to determine whether changes in ROE are due to operational improvements or to higher debt.
Example
Let us use FY2023 data and evaluate Infosys Ltd. for its ROE drivers. The key inputs include the following:
- Net Income = ₹24,095 Crore
- Revenue = ₹1,46,767 Crore
- Total Assets = ₹75,407 Crore
- Shareholders’ Equity = ₹37,500 Crore (Assumed for calculation purposes)
The calculation is the following:
- Net Profit Margin = 24,095/1,46,767 = 16.42%
- Asset Turnover = 1,46,767/75,407 = 1.946 times
- Equity Multiplier = 75,407/37,500 = 2.01 times
DuPont Calculation,
ROE = 0.1642 x 1.946 x 2.01 = 0.642 or 64.2%
Thus, the high ROE of about 64.2% achieved by Infosys Ltd. is driven mainly by a robust net profit margin and efficient asset utilisation, while keeping leverage at moderate levels. This suggests quality earnings above all else.
Shareholders Rule the Roost!
Ultimately, shareholders are concerned about the wealth generated from the utilization of business assets and the conduct of business operations.
In other words, wealth creation is the bottom-line achieved or the net profits earned after the deduction of business expenditure.
This, as a comparison with the equity capital, provides an accurate estimate of the ROE. It must be remembered that equity shareholders are the ultimate owners of the company and the goal of every business enterprise is to create shareholder value.
Example:
Let’s consider an example for a better understanding of the DuPont Model.
Consider two companies X & Y each with an ROE of 20%, operating in the same industry. On further investigation, the breakup is as follows:
RoE = (Net profit margin) * (Asset turnover) * (Equity multiplier)
For Company X: RoE (X) = 20% * 0.2* 5=20%
For Company Y: RoE (Y) = 15% * 1.1* 1.2=20%
| Net Profit Margin | Asset Turnover | Equity Multiplier | |
| Company X | 20% | 0.2x | 5x |
| Company Y | 15% | 1.1x | 1.2x |
In spite of the same overall ROE, the performance of the individual component ratios are very different.
The ROE of Company X is attributable largely to its healthy net profit margin of 20% and high financial leverage of 5x times. While high net profits are highly desirable and indicative of good financial performance, high financial leverage is not optimal.
It is best to have a low equity multiplier, which means that a company requires low debt or borrowings to fund its asset base.
For example, suppose company X has total assets worth Rs 200 crore and stockholders’ equity of Rs 40 crore. Its equity multiplier is 5(Rs 200 crore ÷ Rs 40 crore). The asset funding mix is as follows:
Equity to finance assets= 40/200= 20%
Debt to finance assets= (200-40)/200=160/200= 80%
This is actually a very risky situation, wherein the company is overleveraged or assumed excess debt. In case of a fall in profits, company X could land into a liquidity crisis or in a worst-case scenario, become insolvent, being unable to repay debt. This would go against the fundamental going concern assumption!
In case of the profits take a hit and company X lands in a situation of defaulting on payments to creditors, the borrowers would take over the assets to recover the amounts. In such a situation of limited ownership of business assets, the company may lose valuable assets to debtholders and might ultimately have to shut shop!
Company Y, on the other hand, is able to generate moderate profits with sustainable levels of financial leverage of 1.2x times.
Use Case in Peer Comparison
The main advantage of the DuPont formula in peer comparisons is the ability to determine whether a company's superior ROE is driven by asset usage, higher debt, or operational efficiency, rather than only comparing the final percentage. Here are some key aspects worth noting in this regard:
- Identification of High-Quality vs Risky Returns
Let us assume that two peers may have the same 10% ROE. The DuPont formula will reveal that the first company achieved this through high profit margins (operating efficiency), while the second company achieved it through high leverage (greater risk). - Sector Benchmarking
Helps compare companies with varying business models, e.g., high-margin/low-turnover (luxury brands) versus high-turnover/low-margin entities (retail or FMCG). - Efficiency in Asset Management
Helps in comparing how effectively companies use their assets to generate revenue (asset turnover). This is vital for industries that are capital-intensive by nature.
Let us take an example in this case:
|
Key Metric |
Company 1 |
Company 2 |
Meaning |
|
ROE |
10% |
10% |
Equal on paper |
|
Net Profit Margin |
5% |
3% |
Company 1 has better cost control |
|
Asset Turnover |
0.2x |
1.1x |
Company 2 uses its assets better |
|
Equity Multiplier |
5x |
1.2x |
The first company is riskier, while the second company is safer |
So, in this case, the second company (Company 2) is arguably the safer investment.
How Leverage Can Artificially Lift ROE
In some cases, leverage may sometimes artificially lift the ROE. Here’s how:
- Reducing the Denominator (Equity)
By taking on more debt to buy back shares or pay dividends, the company reduces its overall equity. As shareholder equity declines, the equity multiplier (assets/equity) increases. Even if net income remains flat, a smaller equity base may lead to a higher ROE percentage. - Borrowing for Investments
If a company borrows money (debt) to fund assets that produce a return greater than the debt’s interest cost, the additional profit will accrue to the shareholders. This will amplify the overall return on the limited equity. - Amplification of Moderate Returns
An entity with lower operating efficiency (low margins or low turnover) may still achieve a higher ROE by carrying a large amount of debt relative to its equity.
Limitations of DuPont Analysis
Some of the limitations of the DuPont analysis include the following:
- Dependence on accounting data (risks of manipulation): The analysis is dependent on input data (net income, equity, assets) from financial statements. It may sometimes be distorted by company management through aggressive accounting policies. This may sometimes make the final output misleading.
- Looking Backwards: Historical data is used, which may fail to forecast future performance or account for sudden shifts in industries or competitive changes.
- Incomparability of Industries: This is ineffective for comparing entities across multiple industries. Also, sector-specific margins and leverage norms may vary.
- Neglecting Non-Financial Aspects: Qualitative factors, such as management quality, brand reputation, and regulatory changes, are not taken into account (even though they are useful for determining long-term value).
- No Cash Flow Insights: The focus is on net income rather than cash flow, which can sometimes conceal liquidity problems.
- Assuming a Linear Relationship: A linear, simplistic relationship is often assumed among ROE components, which may not hold in more volatile scenarios.
Example of ROE Trap
Let’s take an Indian real estate firm during a 2-year slowdown. There are low margins, since reduced sales have cut profitability (lower net profit margin). There is low asset turnover (inventory of completed flats is not selling), while debt is high (the trap), with the company taking on more loans to finish its projects (high equity multiplier).
So, what happens now is the following:
Company (Year 1): 5% (margin) x 0.5 (turnover) x 2.0 (leverage) = 5% ROE
Company (Year 2-Trap): 2% (margin) x 0.4 (turnover) x 6.25 (leverage) = 5% ROE
So, while the ROE stays at 5%, the company is riskier in the second year due to its heavy debt levels and reduced margins.
When DuPont Analysis Falls Short
Here are contexts where DuPont analysis may be less useful:
Banks & NBFCs
- High leverage is operational - The model uses the equity multiplier for financial leverage measurements. Banks and NBFCs operate with higher debt-to-equity ratios than industrial entities, making the equity multiplier appear misleadingly high at times (rather than indicating poor risk management).
- Ineffective asset turnover - The model relies on asset turnover to measure efficiency. Yet, a bank's assets are mainly financed by instruments, i.e., investments and loans. They do not generate revenue like manufacturing equipment, for example.
- Interest as the driver of business - Financial companies treat interest expense as a cost of goods sold, although it is treated as a financing cost in the 3-step DuPont model. As a result, tailored versions of the formula are necessary for these sectors.
Unusual Capital Structures
- Weakness Concealed by High Debt - If a company is highly leveraged, it may indicate a high ROE that obscures low profit margins or poor operational performance.
- Negative Equity - If a company has losses exceeding its equity, the capital structure will be distorted, resulting in a negative equity multiplier. This renders the entire DuPont formula invalid, as it depends on positive equity for ROE calculations.
Key Questions to Ask
As one can see from the above examples, Du Pont analysis raises vital questions like:
- Are the high profits of company X sustainable in the long run? Is the high net profit margin owing to better pricing power or a decline in cost? If it is because of a decline in costs, whether the reduction a temporary phenomenon due to the business cycle? Whether company X enjoys better pricing due to gradually becoming an industry monopoly? Whether company X enjoys a first-mover advantage or brand equity?
- Why is company X overleveraged?
- Why is the asset turnover of company X negligible? Is it attributable to higher inventory holding or inadequate capacity utilization of the production facility?
- How is company Y able to effectively utilize its asset base?
Thus, the DuPont analysis provides valuable findings into the business operations, strategy, revenue model, balance sheet strength and profitability metrics of the company, which is not clear if one was to consider the ROE of 20% on a standalone basis.
One can also compare the change in ROE over time and benchmark the performance with industry peers. This would help identify the good performers and the outliers in each sector.
Final Thoughts
It is prudent to include DuPont Analysis in your portfolio evaluation tools. Besides studying the financial statements, it makes sense to also study the individual components of the DuPont formula that provide valuable insights on business performance and risks.
This would help to make a decision as to whether one must hold on, sell or buy a stock based on its intrinsic worth as well as comparison to industry peers.
One must always remember to adopt a consolidated approach in stock picking rather than a standalone, narrow view of merely quarterly or annual declared results.
The DuPont analysis is a ratio measure that is a powerful tool when it comes to the evaluation of diverse financial parameters, risk factors and business performance of a company’s stock.
Happy Investing!