How to Read Japanese Candlestick Pattern MARUBOZU?
Japanese Candlestick Charts are versatile tools that are used by seasoned traders to analyze stock markets. There are different types of Japanese Candlestick Patterns including Spinning Tops, Marubozus, and Doji’s.
Today, we are going to focus on the Marubozu Japanese Candlestick Pattern and discuss ways in which you can use it effectively.
What is Marubozu?
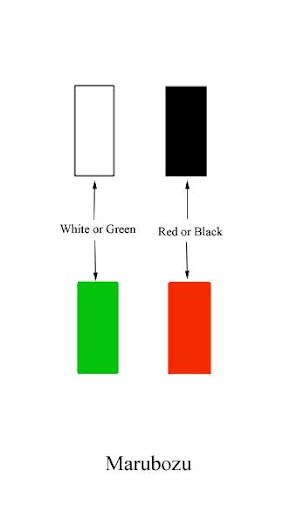
In Japanese, the word Marubozu means ‘shaved head’. If you look at a Marubozu candlestick, the first thing you will notice is that it has only a body and no tail, wick, or shadow.
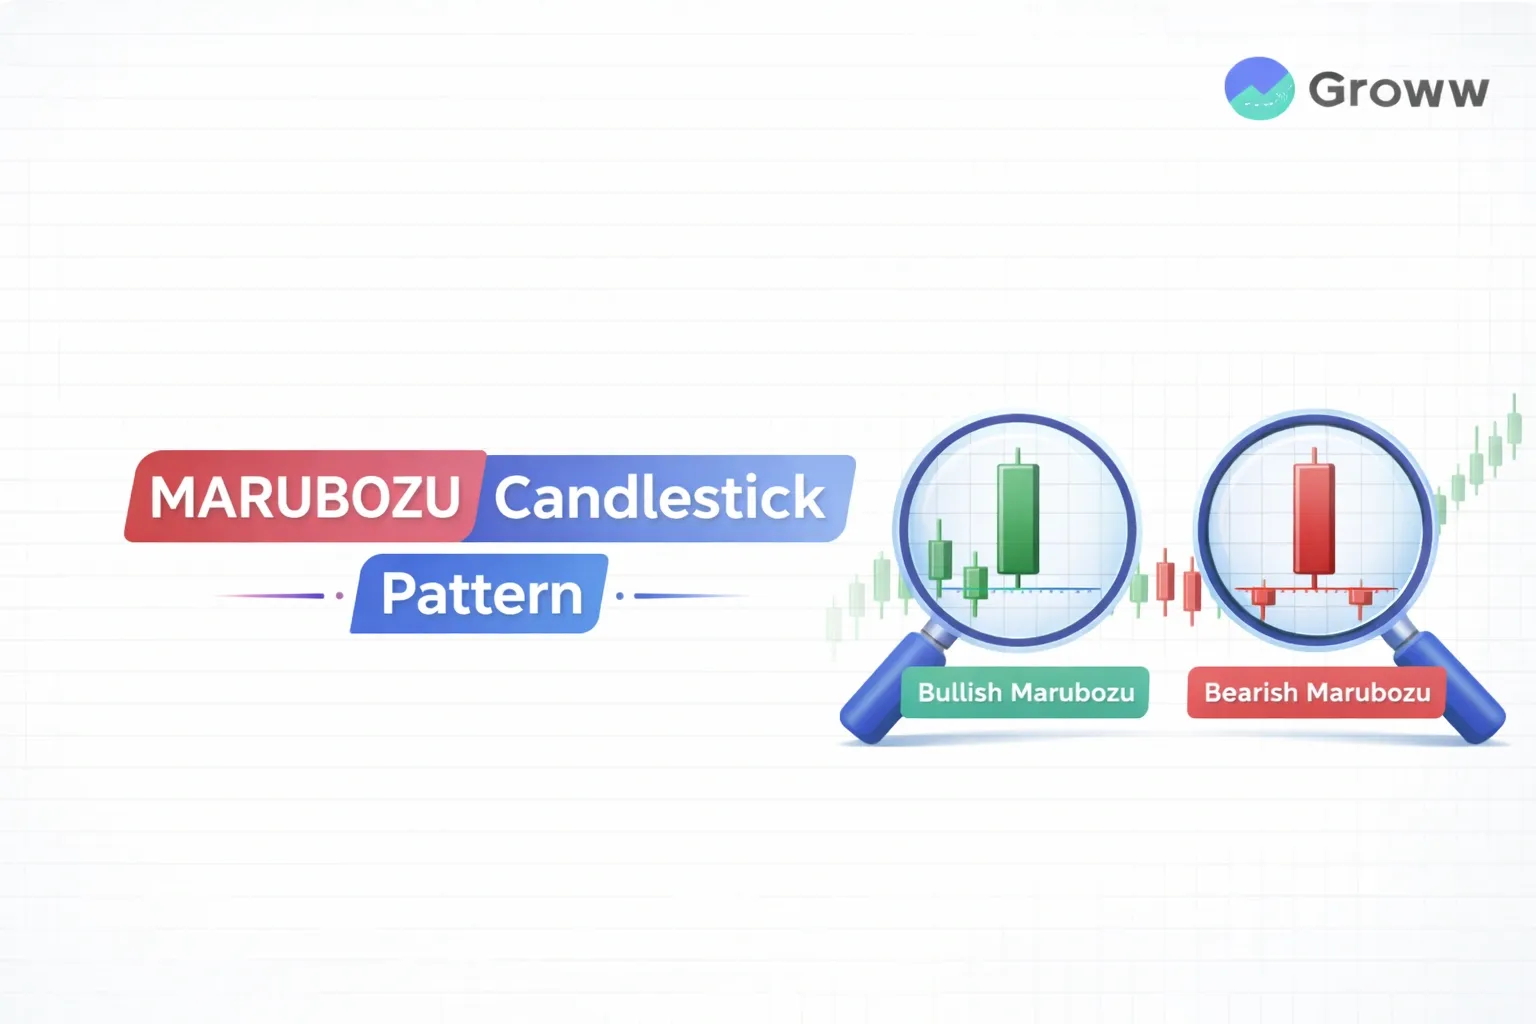
Marubozus are used by traders to identify strong bullish or bearish patterns. The lack of shadows or wicks indicates that the chart does not extend beyond the price range of the opening day. There are two types of Marubozus:
- White/Green
- Black/Red
White/Green Marubozu
A Green/White Marubozu has a long body that is either green or white in colour with no wicks or shadows. This implies that the opening price is equal to the market low and the closing price is equal to the market high.
In simpler terms, the candle opened at its lowest price and closed at the highest price. This is an indicator of a market that is highly bullish. Depending on the period that you are looking at the chart for, this candle indicates a bullish sentiment. This can either indicate a bullish reversal pattern or the continuation of a bullish cycle. It also indicates that the buyers dominated the market.
Black/Red Marubozu
A Red/Black Marubozu has a long body that is either red or black in colour with no wicks or shadows. This implies that the opening price is equal to the market high and the closing price is equal to the market low.
In simpler terms, the candle opened at its highest price and closed at the lowest price. This is an indicator of a market that is highly bearish. Depending on the period that you are looking at the chart for, this candle indicates a bearish sentiment. This can either indicate a bearish reversal pattern or the continuation of a bearish cycle. It also indicates that the sellers dominated the market.
Also, Read - Bull vs Bear Market
Colour and Location of a Marubozu
It is important to remember that the colour and location of a Marubozu can indicate certain trends, as explained below:
White/Green Marobozu at the end of an uptrend
If you have been observing an uptrend in the price of a stock and observe a White/Green Marubozu at the end of it, then it can be a strong indicator of the continuation of the uptrend. This is because the White/Green Marubozu usually indicates a bullish sentiment that is likely to drive the price further up.
White/Green Marobozu at the end of a downtrend
If you have been observing a downtrend in the price of a stock and observe a White/Green Marubozu at the end of it, then it can be a strong indicator of the reversal of the downtrend. This is because the White/Green Marubozu usually indicates a bullish sentiment that is likely to begin driving the price up.
Red/Black Marobozu at the end of a downtrend
If you have been observing a downtrend in the price of a stock and observe a Red/Black Marubozu at the end of it, then it can be a strong indicator of the continuation of the downtrend. This is because the Red/Black Marubozu usually indicates a bearish sentiment that is likely to drag the price further down.
Red/Black Marobozu at the end of an uptrend
If you have been observing an uptrend in the price of a stock and observe a Red/Black Marubozu at the end of it, then it can be a strong indicator of the reversal of the uptrend. This is because the Red/Black Marubozu usually indicates a bearish sentiment that is likely to begin dragging the price down.
You might be also interested to know How to read candlestick charts for intraday trading
Summing Up
While analyzing stock market charts, it is important to have a good understanding of various patterns as it can help make estimate trends and make investing decisions.
However, it is important to remember that such analysis must be backed by comprehensive research on the company, its financials, and its fundamentals.
Good Luck!
Disclaimer: This blog is solely for educational purposes. The securities/investments quoted here are not recommendatory.