How to Read Double Top and Double Bottom Pattern?
There are many ways of analyzing a stock chart. Over the years, experts and seasoned investors have devised various tools and patterns to help investors identify trends and predict potential price actions.
Today, we will be discussing one such pattern – Double Top and Double Bottom pattern.
Before we delve into the Double Top and Double Bottom pattern, it is important to note that this is a type of price reversal pattern.
A price reversal pattern is a price pattern that indicates a change or reversal in trend. This means that if the price of a stock has been in the uptrend and a price reversal pattern is observed, then it is likely that the price will commence a downtrend.
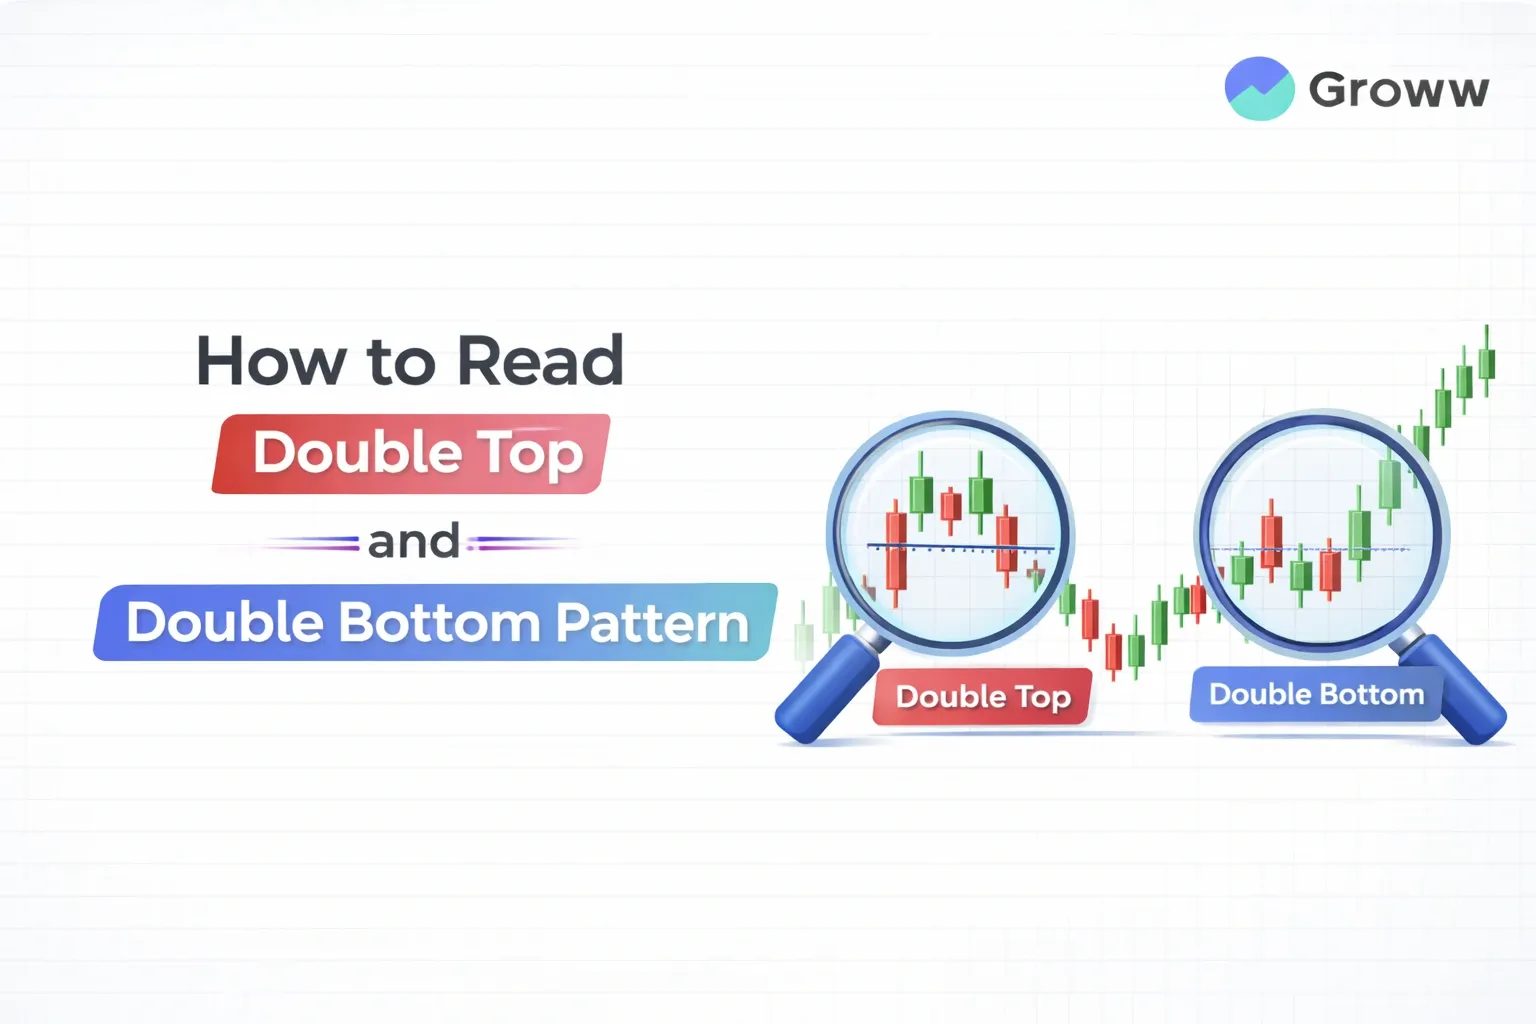
What is a Double Top Pattern?
Double Top Chart Pattern is an M-shaped pattern with two peaks with a moderate decline between them. This is a bearish reversal pattern that usually signals the beginning of a downtrend.
The first peak is usually formed after a strong uptrend. The trend retraces to a ‘neckline’ level. Once it reaches the neckline, it turns bullish and rises to form a second peak. The pattern is finally completed when the price moves to the neckline after the second peak.
Traders look for the price to break through the neckline to confirm a bearish trend reversal.
What is a Double Bottom Pattern?
This is a W-shaped pattern with two lows with a moderate incline between them. This is a bullish reversal pattern that usually signals the beginning of an uptrend.
The first low is usually formed after a strong downtrend. The trend retraces to a ‘neckline’ level. Once it reaches the neckline, it turns bearish and falls to form a second low. The pattern is finally completed when the price moves to the neckline after the second low.
Traders look for the price to break through the neckline to confirm a bullish trend reversal.
How Can Traders Use These Patterns?
The first thing that you need to keep in mind is that a Double Top or Double Bottom pattern is a price reversal pattern. However, you must remember that while these patterns can indicate trend reversals, they are not certain.
Hence, traders must ensure that they consider other indicators before making a trading decision.
Here are some tips:
Double Top Pattern
- It is important to ensure that you assess the phase of the market. A Double Top can be confirmed only after an uptrend.
- You must make sure that you identify the Double Top pattern correctly and pay attention to the size of the peaks
- When the price breaks from the neckline or support level, traders can take a short position
Double Bottom Pattern
- A Double Bottom is formed after the end of the downtrend. Hence, make sure that you assess the phase of the market before making a trading decision.
- Pay attention to the shape and size of the lows in the Double Bottom pattern
- Traders should opt for a long position if the price breaks from the neckline.
Summing Up
While chart patterns like Double Top and Double Bottom can help you identify trends and determine entry and exit positions, traders must ensure that they look for other indicators before making a decision.
Though Double Top and Bottom patterns are not easy to miss, they must be followed by an uptrend or downtrend, respectively.
Remember, many traders limit their profits or even suffer losses by misinterpreting a Double Top or Double Bottom pattern. Therefore, ensure that you look at other indicators like volume and market cycles before entering a position.
Good Luck!
Disclaimer: This blog is solely for educational purposes. The securities/investments quoted here are not recommendatory.