Price Action Trading Strategies: Meaning & How to Trade
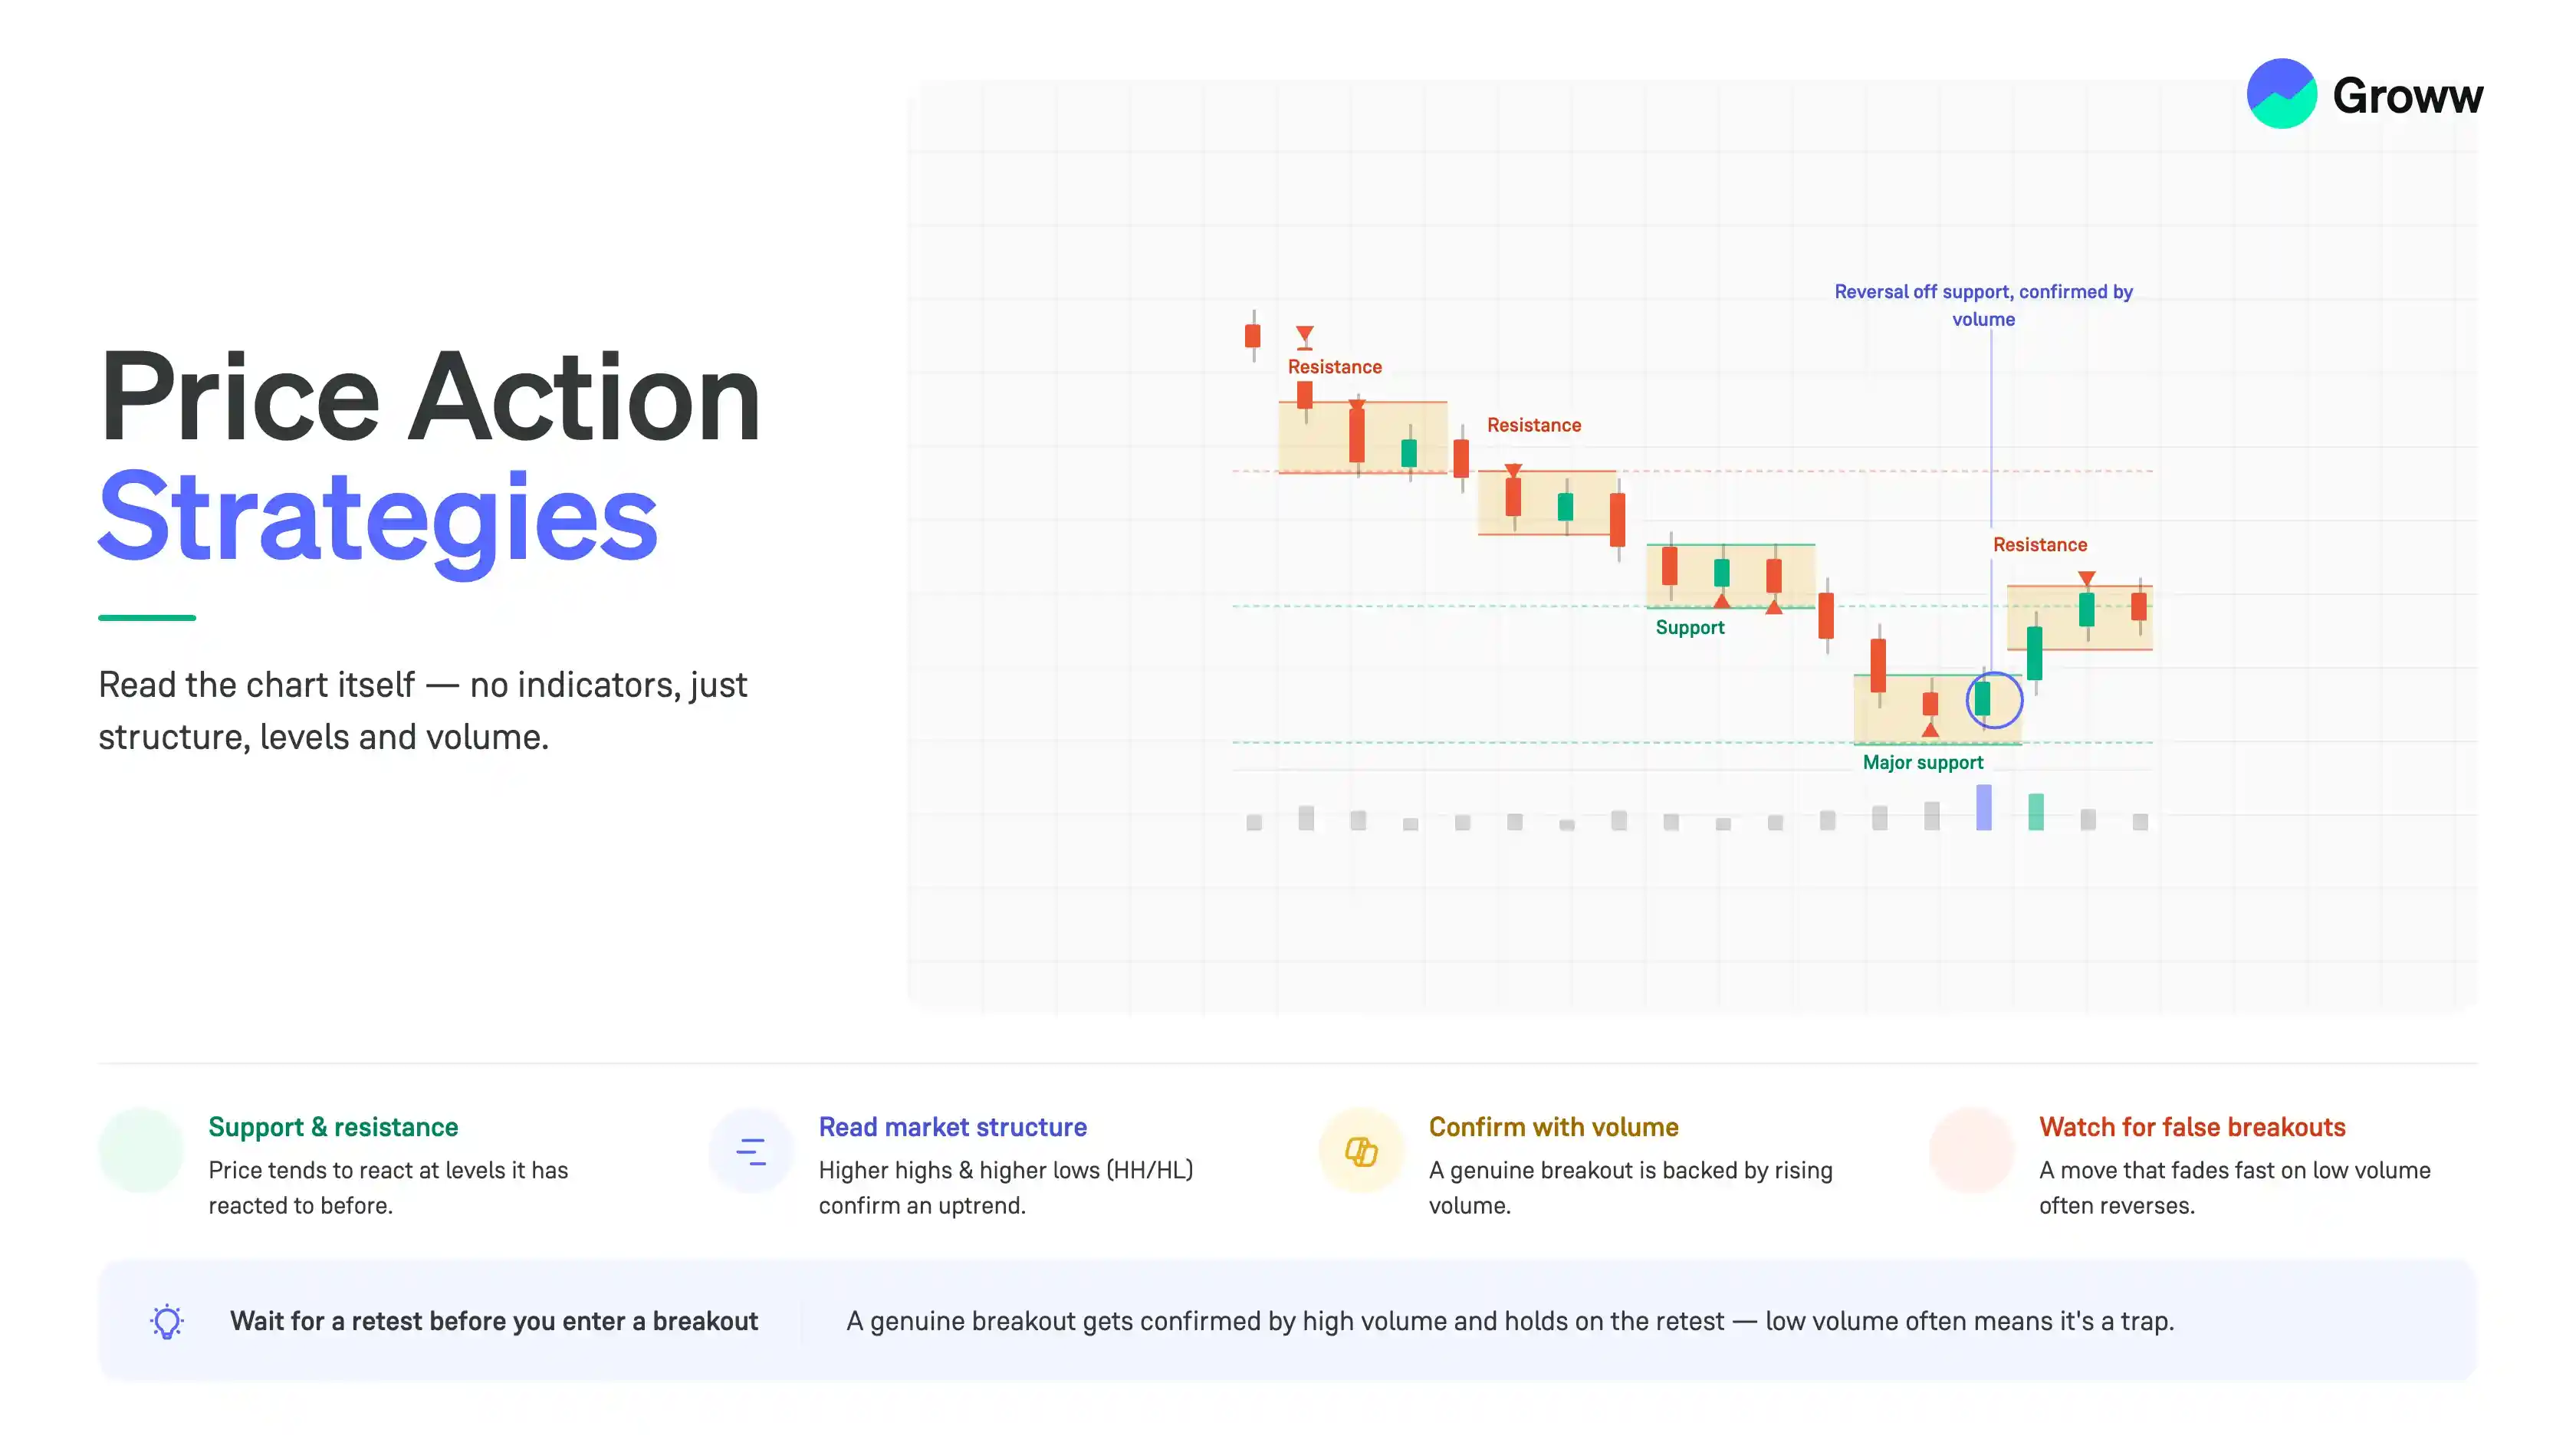


Day traders use a wide range of strategies to take positions on stocks or assets that can generate profits during a trading day. There are numerous indicators offered by the technical analysis of stock market charts that are used by day traders to determine trading positions.
Price Action Trading is a different approach as it is not based on technical analysis but on the understanding of price movements of stocks to find entry and exit positions.
In this article, we will explore price action trading and help you understand it better.
Price Action Trading: What It Is and How It Works
Price action trading is actually an art. This involves analysing and trading based on raw price movements, i.e., support/resistance, market structure, candlestick patterns, and volume. This is done without relying on lagging indicators like moving averages or RSI.
Price action is often perceived as a cleaner method in the National Stock Exchange (NSE) or the Bombay Stock Exchange (BSE), where gap-ups and downs, volatility and operator-driven moves are common. Here are some key points worth noting in this regard.
- Indicators Lag but the Price Leads: It is the main philosophy of price action trading. However, the main point is that, rather than waiting for a moving average crossover, traders react to price action in real time.
- Focusing More on Market Structure: Traders may identify market trends using HH (Higher Highs) and HL (Higher Lows) to identify uptrends. They may also use Lower Highs (LH) and Lower Lows (LL) for downtrends.
- Understanding Operator Activity: Since Indian markets are often impacted by FIIs/DIIs and other institutional players, price action helps identify when smart money enters, stops, or reverses, particularly around core levels.
- Raw Chart Readings: This involves using clean charts, mostly only candlesticks, on a 5-minute (for intraday trading) or daily chart (for swings). There are horizontal lines for major Support and Resistance zones.
The core elements of price action include:
- Support & Resistance Zones: Vital and high-volume levels, especially round numbers or the earlier day’s high or low.
- Candlestick Patterns: Recognising patterns that are sentiment indicators, such as Engulfing patterns, Hammers (rejection), Shooting Stars and Dojis (instead of memorising them, but understanding the internal dynamics).
- Market Trends & Structure: Evaluating price swings, lows, highs and closing levels to find the dominant direction of the market.
- False Breakouts & Breakouts: Usually, when the price breaks out of a consolidation phase, or alternatively, identifies traps or false breakouts (common in Indian markets).
Here’s why price action trading strategies work well:
- High volatility: Price action can capture sharp intraday moves shown across Indian indices and stocks (Bank Nifty/Nifty).
- News-oriented movement: When news updates are released, technical indicators may require time to react, although the price reacts instantly.
- Simplicity over noise: This eliminates confusion from multiple indicators on the chart, offering a clearer view of market sentiment.
A usual price action setup is thus the following:
- Key Tools: Support/resistance, volume, trendlines, and naked charts
- Focus Area: Identification of major price levels (23,000, 25,000, etc.) and waiting for the price to react to the same
- Risk Management: Leveraging more precise stop-losses based on the structure (putting a stop below a bullish hammer’s low, for example)
- Timeframes: 5/15 minutes for intraday (Nifty/Bank Nifty) and Daily for swing trading
Understanding Candlestick Patterns
Before identifying candlestick patterns (representative of buying and selling pressure) in context, it is essential to understand that price action is most effective when fused with market context. Let us look at some of these patterns in more detail below:
Reversal Patterns:
- Hammer/Hanging Man: This indicates a possible reversal after an uptrend or downtrend.
- Bullish/Bearish Engulfing: You’ll find a strong candle that fully covers the earlier candle, thereby indicating a shift in momentum.
- Morning Star/Evening Star: These patterns consist of three candles each and signal a strong reversal trend.
Continuation Patterns:
- Inside Bar: This indicates a pause before the trend resumes.
- Rising/Falling Three Methods: This is a brief pause in an otherwise strong trend.
Remember that a bullish reversal pattern only holds relevance in case there was a bearish trend preceding it. Wait for confirmation on the next candle before trading a pattern, and don’t act immediately. The volume should ideally confirm the price action in question, i.e. higher volume on a bullish engulfing pattern. You should also be flexible in interpreting patterns, since minor variations arise due to market volatility.
Engulfing Candle Example at a Key Price Level
Let’s consider a company’s stock falling towards ₹2,350 but closing near its high, leaving a long lower wick or tail. This indicates sellers are attempting to push it downwards, but buyers are rejecting it. It is a pin bar rejection (support) where a classic bullish reversal occurs, and this pattern is often seen in the Indian market. Then there is the engulfing pattern (resistance).
Now, suppose a small green candle is fully consumed by a large red candle at an earlier resistance level, i.e. Nifty at 22,000 or so. This will indicate that the bulls have been fully overwhelmed by the bears.
Here’s how you can trade pin bars and engulfing at levels:
- Identify the level (find strong and historical support/resistance zones).
- Wait for the setup first.
- If it is a pin bar, then look for the long tail (at least more than 2/3rds) of the total candle length at the support/resistance. If it is engulfing, then a full-body candle will cover the earlier body.
- You can enter after the candle closes or upon the breakout of the nose of the candle.
- Place the stop-loss just below the pin bar tail or just below the support level.
- Target the next major resistance level for your exit.
So, let’s assume a stock comes down to a support level of ₹1,000 and a bullish pin bar forms (a long lower wick), you may purchase at ₹1,005 with your stop-loss set at ₹990. You can aim for ₹1,030 in this case.
Market Structure: Higher Highs/Lows, Lower Highs/Lows
Let us take a closer look at the market structure in this case.
- Uptrend/Bullish Structure: Characterised by a sequence of HH (Higher Highs) and HL (Higher Lows). The strategy in this case is buying on pullbacks (HL) to support zones.
- Downtrend/Bearish Structure: Characterised by a sequence of LH (Lower Highs) and LL (Lower Lows). The strategy in this case is selling on rallies (LH) to resistance zones.
- Structural Break/Reversal: There is a bullish break when a stock breaks above an earlier LH, thereby breaking the downtrend (LHs/LLs). A bearish break happens when a stock breaks an earlier HL below, thereby breaking the uptrend (HHs/HLs).
- Sideways Trends: This is when prices move within a horizontal range, often indicating no clear sequence of higher or lower points.
Here is a comparison table for a better understanding of the same:
|
Market Structure |
Sequence of Highs/Lows |
Market Sentiments |
Main Action |
|
Uptrend |
Higher Highs/Higher Lows |
Bullish |
Buy the Pullback (HL) |
|
Downtrend |
Lower Highs/Lower Lows |
Bearish |
Sell the Rally (LH) |
|
Sideways |
No Sequence |
Indecisive Scenario |
Range Trading/Wait |
Understanding Support and Resistance Levels
Support and resistance are key concepts in this context. For instance, support refers to price levels at which buying interest is strong enough to counteract further declines. It therefore works as a floor.
Resistance is the price level where selling pressure halts any upward momentum and acts as a ceiling of sorts. There is often a role reversal where a broken support transforms into resistance, and a broken resistance often becomes support.
Psychologically, round numbers like Bank Nifty 48,000 or Nifty 22,000, or stock prices like ₹500 or ₹1,000, serve as robust psychological support and resistance levels in the country.
Here’s how you can strategically identify support and resistance:
- Horizontal Levels: Find historical chart zones where prices have reversed several times.
- Trendlines: Link consecutive higher lows in an uptrend (support) or even lower highs in a downtrend (resistance).
- Pivot Points: Leveraging the previous day's high, low, and close, pivot points provide objective, automated support and resistance levels. These are extensively used by day traders in the market.
- Fibonacci Retracement: Levels like 38.2%, 61.8% or even 50% are often used to identify possible support during any trend correction.
Some actionable price action strategies also include the following:
- Bounce trades: Wait for the price to hit any support or resistance level. Look for confirmation through candlestick patterns like Doji, Pin Bar, and Hammer, and only enter when prices start to reverse.
- Breakout or breakdown trading: You may enter only when the price breaks above the resistance or below the support with high volume. You can wait for a retest of this broken level to get confirmation.
- Range trading: You may buy near the support and sell near the resistance when the market moves horizontally between two established levels.
Example of Price Reaction at Support and Resistance
Let us consider an example in which a specific stock, let’s say Company X, has a known resistance level of ₹212, meaning the price has previously struggled to rise above this threshold.
The reaction in this case is worth understanding. When the price rises to ₹212 and cannot break above it, creating a bearish engulfing pattern or pin bar, it indicates that sellers are coming into play.
What can be an actionable strategy in this scenario? You may consider taking a short position near ₹212 (resistance), placing a stop-loss just above the resistance level and aiming for a downward move towards a lower support zone.
Later on, if the price breaks above ₹212 with robust momentum, that level may also flip, acting as support for a subsequent retest. You should watch out for common price action patterns in this case, i.e. pin bars/hammer (indicator of price rejection and reversal signal at key support/resistance levels), inside bars (indicator of a phase of consolidation before a possible breakout) and double tops/bottoms (indicator of a trend reversal when the prices fail to break a level twice).
Effective price-action trading needs you to identify these levels, sometimes at swing lows and highs, while waiting for the breakout or reversal confirmation.
Price Action Trading Strategies
Most price action traders use tools like candlesticks, breakouts, and trends while leveraging support and resistance theories to create trading strategies. Here are some common price action strategies to consider:
Trend Trading
Many traders look at the trends in price movements to make trading decisions. They use various techniques to track and follow trends in market prices. This also allows them to learn from experienced traders by following price action trends.
Price Action Trend Trading includes opening a ‘buy’ position to benefit from an uptrend and a ‘sell’ position if there is a downtrend.
Pin Bar
A pin bar pattern is a candle with a long wick. When you observe a pin bar on a chart, it is usually an indication of reversal or rejection of a specific price. The wick indicates the price range that was not accepted by investors.
Price Action Traders assume that the pin bar indicates that the price might start moving in the opposite direction and choose to decide if they want to take a short or long position.
Inside Bar
This is a two-bar strategy where the outer bar is bigger than the inner bar. The inner bar lies between the low and high range of the outer bar. Usually, inner bars are formed when the market consolidates and can also indicate a turning point in the market.
Experienced traders identify such trends and make an informed guess about whether the inside bar represents a consolidation or a turning point.
Trend After a Breakout Entry
A breakout is when the market moves outside the support or resistance levels. Most day traders assume that after a price spike (in either direction), the stock market will retract. Hence, they use such instances to take long or short positions.
Head and Shoulders Reversal
Usually, markets are volatile, with a lot of ups and downs. A ‘Head and Shoulders’ pattern is when:
The market rises Falls Rises higher than before Falls again Rises to a lower high Drops modestly
This looks like a silhouette of the head and shoulders of a person. It is one of the most popular price action strategies used by day traders. Usually, traders choose an entry point after the first shoulder and set a stop-loss after the second shoulder to take advantage of the peak offered by the head.
Breakouts, Retests and False Breakouts
Let us look at these aspects in more detail below:
Breakouts (Genuine vs Weak):
- A breakout occurs when the price breaks above resistance or below support. This signals a strong move.
- Confirmation: Genuine breakouts are usually backed by high volume. This indicates higher market participation.
- Closing Basis: Rather than trading intraday spikes, you should wait for the price to close below or above the major level, especially on the 1-hour, 15-minute, or daily charts for greater reliability.
- Context: Examine whether the breakout aligns with broader market trends (Nifty movements) and fundamental news or updates (such as policy announcements, earnings, etc.).
Retests (Confirmation):
- A retest happens when the price moves back to the broken level, i.e. the former resistance becomes the support or vice versa, before the new trend continues.
- This matters since it confirms that the market has accepted the new price level and it is not a trap.
- You should only enter the trade when the price bounces off the retested level with lower volume than the breakout volume.
- If the price breaks back below or above the level, it indicates a failed retest. This means that it could be a potential false breakout.
False Breakouts:
- A false breakout occurs when the price breaks a level but then reverses swiftly, thereby trapping those who sold low or bought high.
- One of the key indicators is low volume, with the break occurring amid low trading activity and indicating a lack of conviction.
- Another indicator is long wicks or candles with long shadows (examples include the Hammer or Shooting Star) at the broken level. This suggests rejection in a sense.
- You may find the price making a new high, although the RSI (Relative Strength Index) is making a lower high.
You should wait for a retest before entering, while placing stop-losses a little beyond the breakout level. If a large, high-volume opposite candle appears immediately, it could be a trap. This is often considered an operator breakout.
Example of a Breakout Followed by a Retest
Picture a stock, i.e., Company A, consolidating between, say, ₹200 and ₹215 over multiple sessions, with ₹215 as a robust resistance. The stock price later rises to ₹220 amid high trading volume, indicating robust buying interest. You can wait instead of buying immediately. Then comes the retest phase, i.e., the price falls back to the earlier resistance level (₹215), which now functions as the support.
Then comes the entry phase, where a bullish candle (such as a pin bar or green engulfing) forms around the ₹215-₹217 threshold, confirming the support level. You can now enter a long position.
The stop-loss, in this case, will be placed below the new support level, i.e. around ₹210, to restrict your losses in case it is a false breakout. You can also set the next logical resistance level with a target to move to ₹230-₹235.
Why Volume Matters in Price Action Trading
When it comes to price action trading, volume often supports the same. Here’s how:
- Volume validates the strength of price movements. Without volume, the price move will lack conviction and become a trap for retail market traders.
- When prices rise along with volume, it indicates a healthy, strong uptrend. Alternatively, if prices rise on declining volume, it often indicates a weak move prone to reversal.
- Support or resistance validation is another aspect worth understanding in this regard. A breakout from a resistance level (or a breakdown from support) with high volume is considered authentic. On the other hand, low volume on a breakout may indicate it is false.
- Considerable volume spikes often indicate institutional selling or buying. If the price falls with high volume, it indicates that large players are selling (a bearish trend). If the price increases with high volume, it indicates they are buying (a bullish trend).
Volume-By-Price Example for Key Zones
The HVN (high volume node) is often regarded as the Magnetic Zone. This is a price level that has excessive volume and works like a magnet of sorts, where the price consolidates (value area) before a breakout. Then there is the LVN (low-volume node), or the Breakout Zone. It is a price level with minimal volume. The price passes through these zones swiftly, since it is not defended by institutions, making it a fair value gap.
Suppose the Nifty stalls at 22,500 with a high VBP bar, then it is a strong level of resistance. If it breaks above 22,500 with high volume and then falls back to test it, the 22,500 level will act as support.
A long, red candle on high volume near a resistance zone indicates a robust reversal (selling pressure).
On the other hand, if a stock breaks resistance on low volume, it could be a false breakout. Genuine breakouts usually need a volume surge. If the Nifty touches a new high but volume is lower than at the earlier high, the rally will be weak.
Multi-Timeframe Price Action
Using top-down analysis combats emotional or impulsive trading while also syncing with institutional market activity. Here are some key points to note in this regard -
- Higher Timeframe (Context): You can use daily or weekly charts to identify the core trend and key support and resistance levels.
- Intermediate Timeframe (Structure): You may use 1-hour or 4-hour charts. They help identify structural trends, such as chart patterns and trendlines.
- Lower Timeframe (Entry): You can use 5-minute or even 15-minute charts to identify precise entries, e.g., pin bar confirmations, once the price touches a key zone identified on higher timeframes.
Some of the common multi-timeframe strategies may also include -
- Trend Following: The trend should be confirmed on the daily chart. You can enter a trade on a pull-back on the 15-minute chart in the same trend direction.
- Resistance or Support Trading: Find a major resistance on the daily chart and watch out for reversal candlestick patterns on the 5-minute chart.
- Breakout Blueprint: A break of a consolidation zone on the 1-hour chart, when confirmed by high volume, is the key. Of course, it should be followed by a 15-minute chart retest.
Risk Management For Price-Action Trades
Risk management is vital for price-action trades, especially in volatile markets. Here’s what you can do in this scenario.
- Stop-loss placement: Put stop-losses below the support or above the resistance levels where there is an invalidation of the trade thesis.
- Position sizing: You can restrict risks to 1-2% of your overall trading capital per trade.
- Risk-to-reward ratio: Target a risk-to-reward ratio of at least 1:2, thereby ensuring that your potential profit is a minimum of twice the potential loss.
- Do not overtrade: Restrict the number of trades per day, especially during major news events and updates and also during volatile periods.
- Watch out for operator traps: False breakouts are often tailored to stop out retail players. This is usually seen in stocks with lower liquidity; watch out for the same.
- Neglecting higher timeframes: Trading on the 1-minute chart without analysing the daily trend is not a good strategy.
- Avoid emotional/impulsive trading: Do not fail to follow the predetermined stop-loss level.
Summing Up
To summarize, price action trading is a strategy that uses movements in price to estimate the potential movements in the market. Price Action Traders try to identify trends using actual prices and not moving averages (as is the case with technical analysis).
There are various price action strategies that can be deployed by new and seasoned traders to identify earning opportunities. Make sure that you practice these strategies before deploying them for making trading decisions.
Good Luck!