Understanding Mutual Funds Data in Detail

Mutual Funds provide a lot of data about their portfolio and historical returns to current and prospective investors. Generally, for investors, it’s really difficult to find this mutual fund data and then even more difficult to understand it.
We have created a simple mutual fund page where you can find all data required in easy to understand format.
Let me give you a quick tour of it.
(Here is the link to the mutual fund that I selected for this article – HDFC Balanced Fund)
Most Important Things
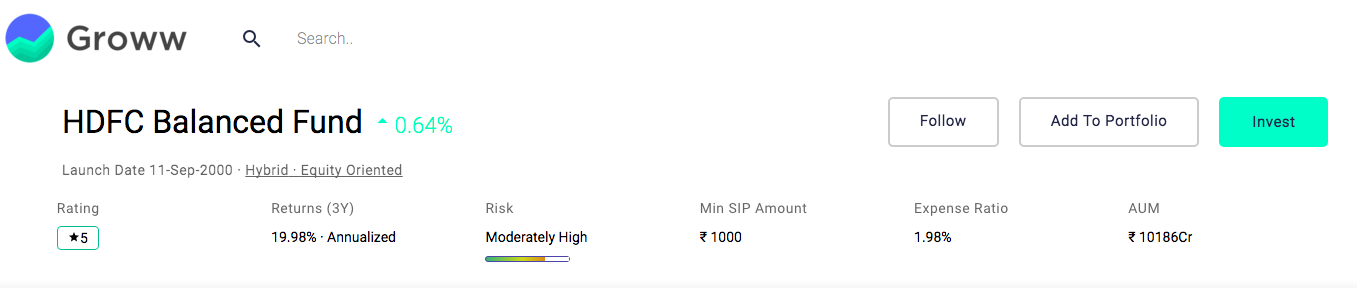
1 Day Returns (just adjacent to the fund name): This is how much the fund’s value has changed in the last 1 day. We update it on daily basis based on the latest NAV (NAV is like the share price of the mutual fund).
Launch Date: This is the date on which the fund was launched. Generally, older funds are better. It means they have survived till date.
Category (Hybrid) and Sub-Category (Equity Oriented): Based on the fund’s objective and its portfolio holding, we determine the fund category (like equity, debt, etc) and sub-category (mid cap, small cap, etc).
Groww Rating: It is generated by us based on historical performance and other data available on the fund.
Returns 3Y: These are the annualised returns you would have gotten if you had invested in this fund 3 years ago. We update it on daily basis based on the latest NAV.
Risk: It is calculated using Standard Deviation (variation of returns from its mean). We have come up with a scale of 7 with a minimum standard deviation of <1% as very low and >20% as very high. We use weekly rolling monthly returns data to calculate risk. We recalculate it every week and make necessary changes.
Min SIP Amount: This is the minimum investment amount you need to invest every month (SIP) in this mutual fund. This is decided by mutual funds themselves.
Expense Ratio: The expense ratio is cut from your investments on a daily basis. It includes fund management fees, distribution expenses, operation expenses, etc. It varies between 1–3% for equity funds and 0.1–1.8% for Debt funds. It’s updated every month based on actual data provided by mutual funds.
AUM (Asset Under Management): This is the value of the total investment made into this mutual fund until the end of the previous month.
SIP Returns
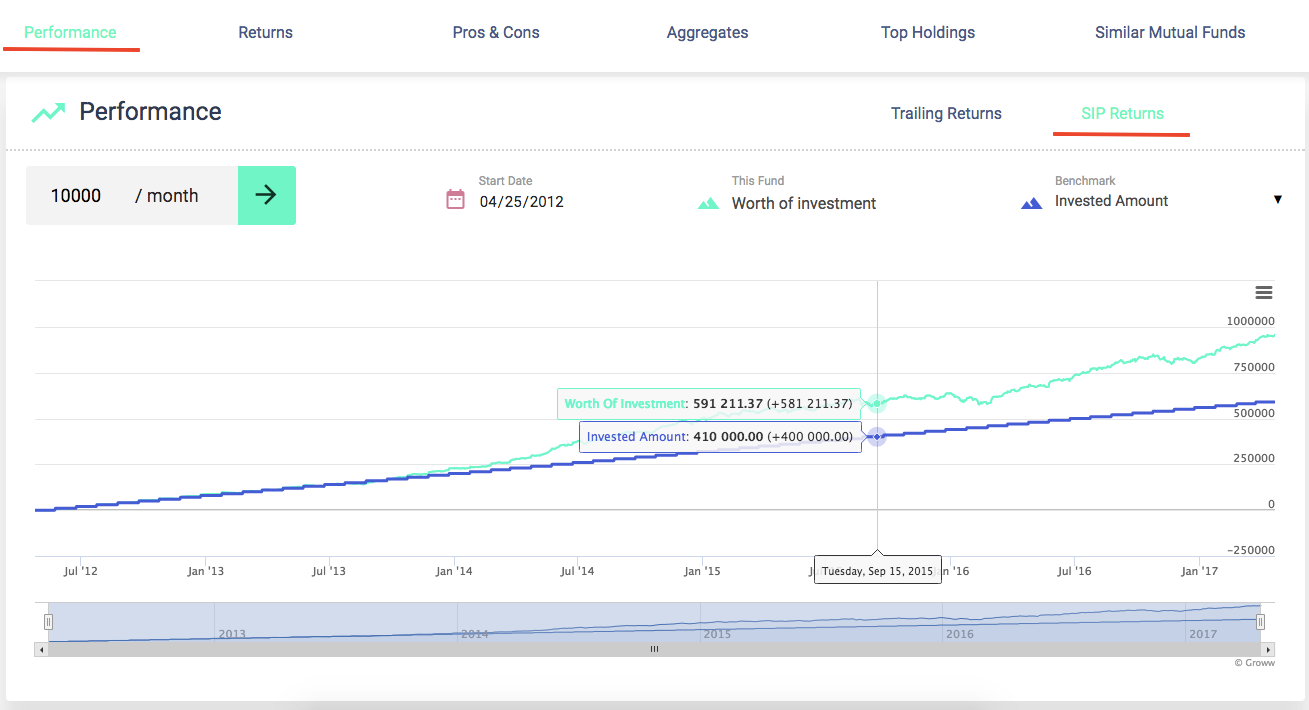
SIP Returns
Next, we show you the performance of the mutual fund if you would have invested in a monthly Systematic Investment Plan (SIP) of this mutual fund. SIP is a regular investment (monthly is the most famous frequency) in the mutual fund, very similar to Recurring Deposit (RD).
You can enter any amount (like Rs. 10,000) to see how a SIP in this mutual fund would have performed if the SIP was started on any given start date (like 25th April 2012). You can change the start date to see the value for different start dates.
Trailing Returns of Mutual Funds
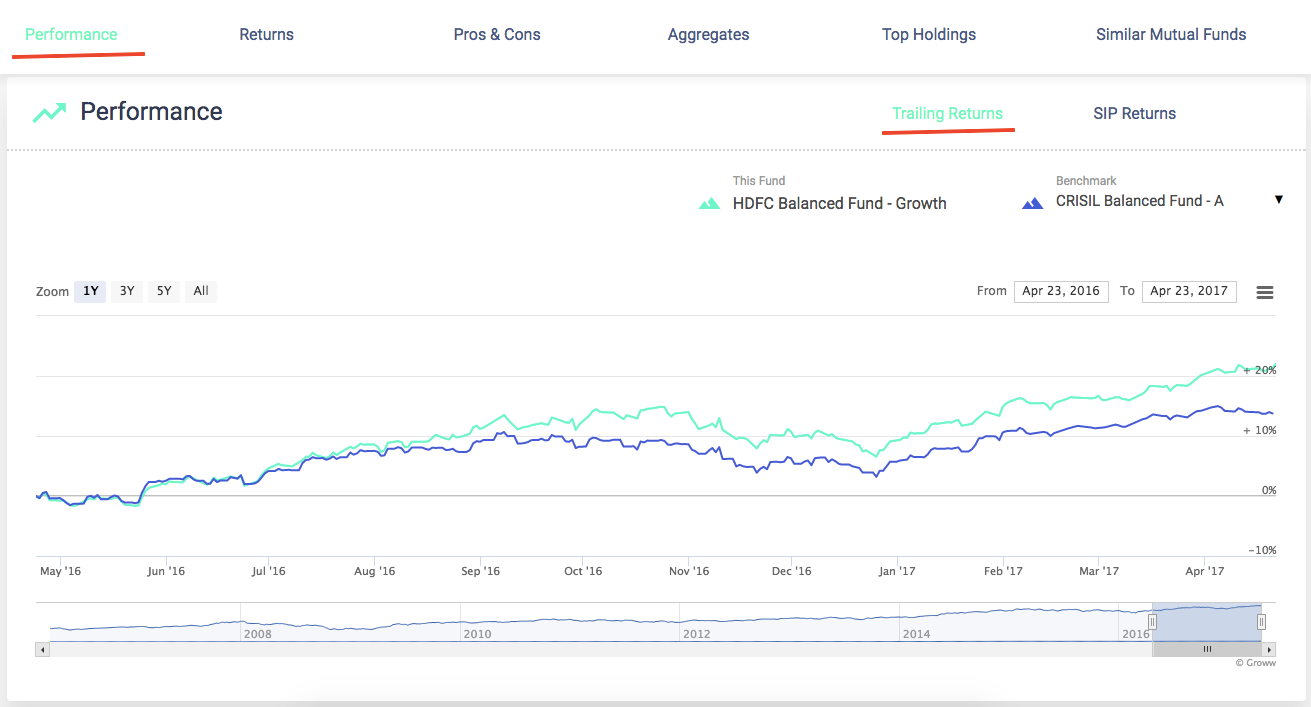
Trailing Returns
Here we show you the performance of the mutual fund if you would have invested in this mutual fund 3 years ago compared to its benchmark (its most comparable index to evaluate this category). You can change both from date and to date.
Historical Returns
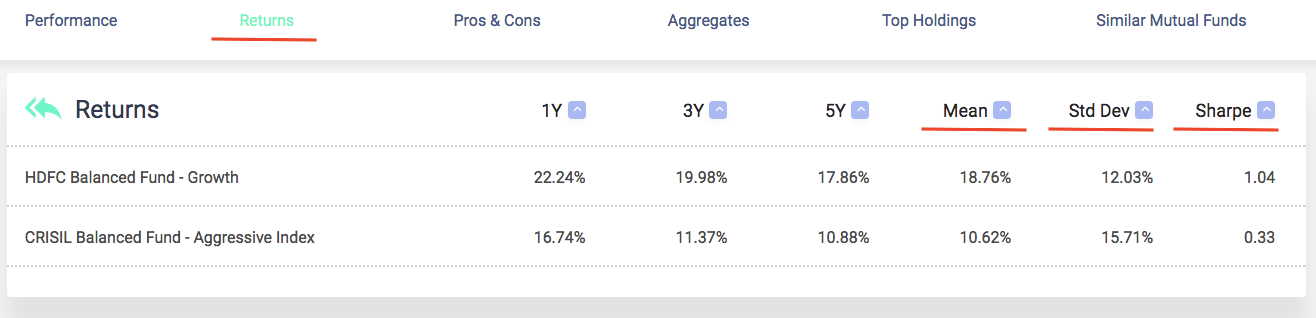
Returns
Mean Returns: It is the average of returns for the last 3 years weekly rolling monthly returns and then annualised. Mean returns are a better measure of expected returns in future than historical returns like 1Y, 3Y, etc.
Std Dev (Standard Deviation): It is the variation of returns from its mean returns. Std Dev shows the risk of the fund.
Sharpe Ratio: It is defined as Mean Returns earned in excess of the risk-free rate per unit of risk (Std Dev). It’s a measure of risk-adjusted returns. It was developed by Nobel laureate William F. Sharpe.
Pros and Cons
Pros and Cons
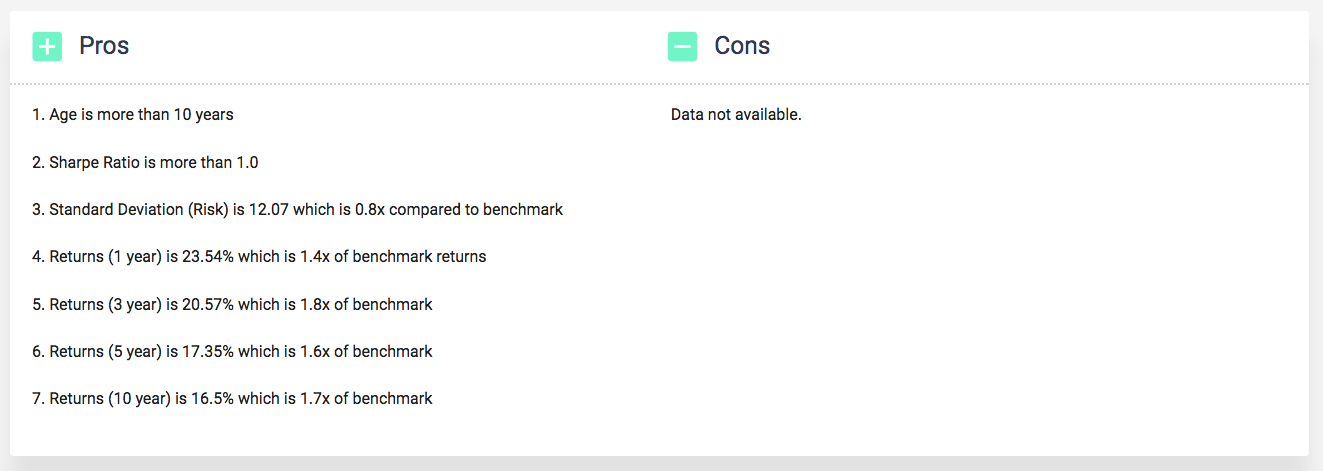
We evaluate all the above-mentioned data points to give key highlights on this fund. This helps you make an informed decision. Let me list down a few important measures-
AUM (Asset Under Management): It should not be too low or too high. With a low AUM, the performance of a fund is not right to measure With a high AUM, opportunities to generate alpha (returns in excess of the benchmark) are minimal and its benefit gets divided.
Age: A fund which is not even 5 years old has very limited data to take a call on its future performance. Higher the age, the better.
Historical Returns: A comparison of historical returns with its benchmark tells you about the consistency of the performance of this fund. A fund should outperform the benchmark across time periods
Risk: A comparison of Std Dev with its benchmark tells you about the risky nature of this fund. The fund should not be too risky compared to its benchmark.
Sharpe Ratio: Higher the Sharpe it’s better. My thumb rule is anything above 1.0 is good.
Holding Analysis
Holding Analysis
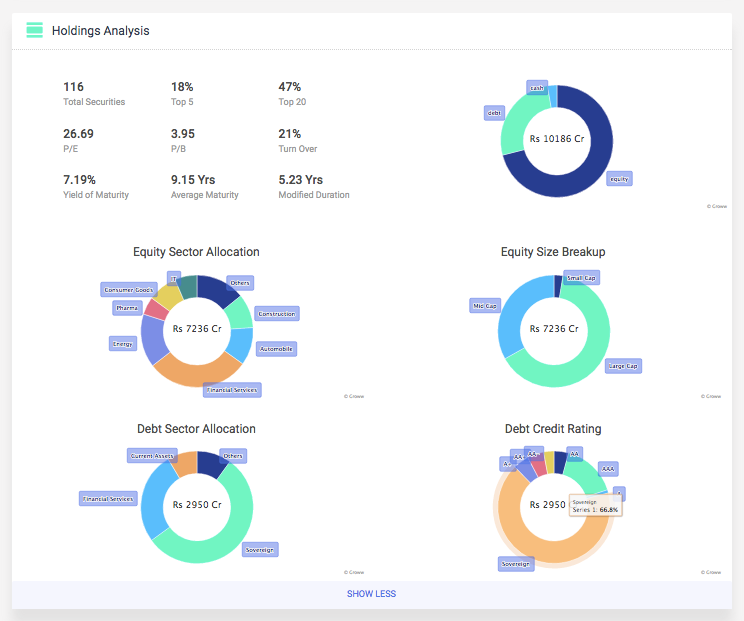
Mutual funds invest in a portfolio of market securities, So it’s important to see what kind of investment they are doing. Following are a few data points that help you understand the nature of these securities:
Concentration Measures
- Total Securities: Number of securities in which this fund has invested.
- Top 5: Weight of top 5 securities in the portfolio.
- Top 20: Weight of top 20securities in the portfolio.
Valuation Measures (Equity)
- P/E: Average trailing P/E ratio (Market Cap of the equity divided by Net Profit in the last 12 months) of equity securities in the portfolio. One of the most famous valuation measures. Lower is better.
- P/B: Average trailing P/B ratio (Market Cap of the equity divided by last available Net Worth) of equity securities in the portfolio. Lower is better.
- Turnover: It measures the churn on the equity portfolio in the last 12 months.
Valuation Measures (Debt)
- Yield to Maturity (YTM): Average interest rate earned by an investor at today’s market price, assuming that all debt securities (bond, loan, etc) will be held until maturity (the final payment date of debt security, at which point the principal is due to be paid).
- Average Maturity: Weighted average maturity of all debt securities held by the fund. Lower is better.
- Modified Duration (MD): It is the sensitivity of debt securities to the interest rate. If MD is 1 and the interest rate increases by 1%, the value of the debt securities will reduce by 1%. Lower is better.
Charts
Asset Allocation: Share of the value of total holding of the fund in debt, equity or cash (money market instruments, gold, etc). It tells you about the true nature of the fund.
Equity Sector Allocation: We have sub-divided the equity holding to understand the sector break-up. It basically tells you about the percentage exposure of equity holding to a particular sector (Financial Services, IT, etc).
Equity Size Allocation: We have sub-divided the equity holding to understand the size break-up. It basically tells you about the percentage exposure of equity holding to a particular size. Equity is divided into 3 categories by size: Large Cap, Mid Cap, and Small Cap.
Debt Sector Allocation: We have sub-divided the debt holding also to understand the sector break-up. It basically tells you about the percentage exposure of debt holding to a particular sector (Financial Services, IT, etc)
Debt Credit Rating: We have sub-divided the debt holding to understand their credit rating (it tells you about the possibility of not getting the money back from debt securities). Sovereign/ AAA/ A1+is the best ratings whereas D/A4 are among the worse.
Top Holdings:
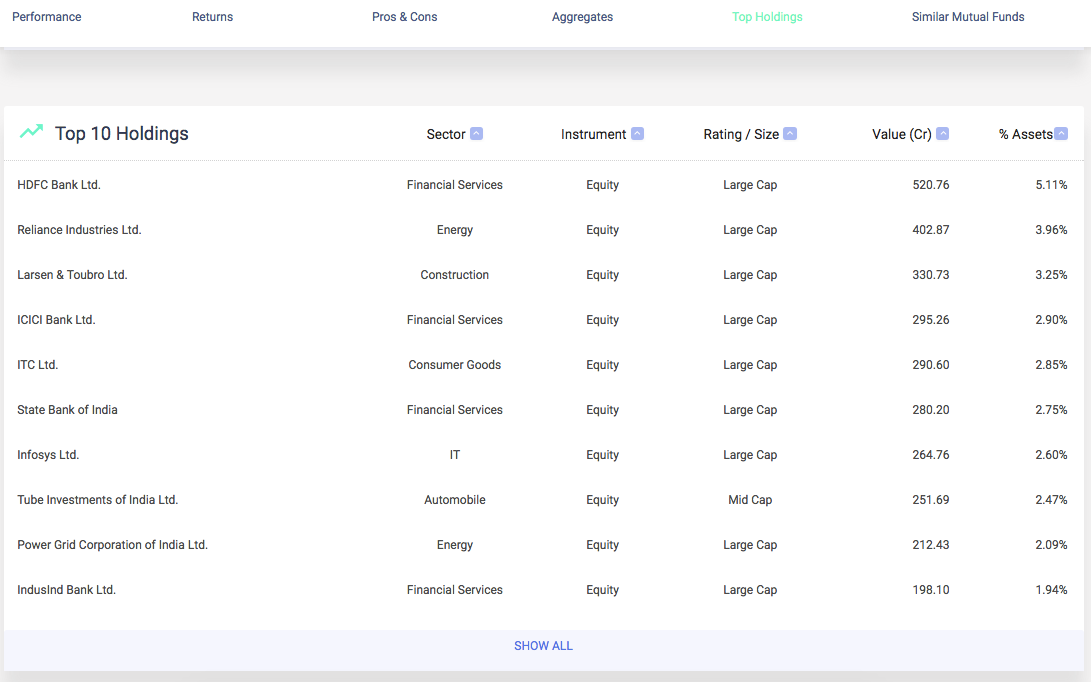
Top Holdings
After the holding analysis, we also show you individual holdings for you to look at and take confidence. By clicking on ‘Show All’, you can actually see all the holdings of the fund.
Other Details:
Other Details
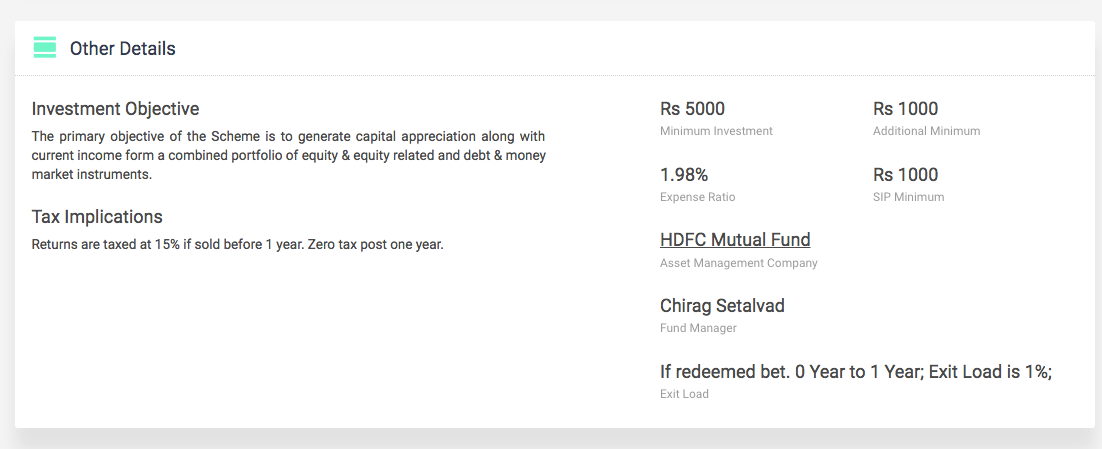
- Investment Objective: This is the objective stated by the AMC for this mutual fund. AMC will operate this mutual fund in this manner. But most of these objectives are very vague and hence don’t tell you much about the intent of the AMC.
- Tax Implication: We tell you about how returns on this mutual fund will be taxed. It depends mostly on the category of the mutual fund.
- Minimum Investment: It is the minimum investment this fund is going to accept if you are doing a one-time investment.
- Additional Minimum Investment: It is the minimum investment this fund going to accept if you have already invested in this fund and want to invest more.
- Asset Management Company (AMC): It’s basically the company that manages this mutual fund.
- Fund Manager: This is the person appointed by AMC to manage this fund.
- Exit Load: Some mutual funds have a restriction on the redemption of the money from the fund. For example, if you redeem before 1 year they will charge you 1% of the amount redeemed. This charge is called Exit Load. I think it’s fair for equity/ balanced to charge exit load as an investor is expected to invest for the long term in these funds.
Similar Mutual Funds:
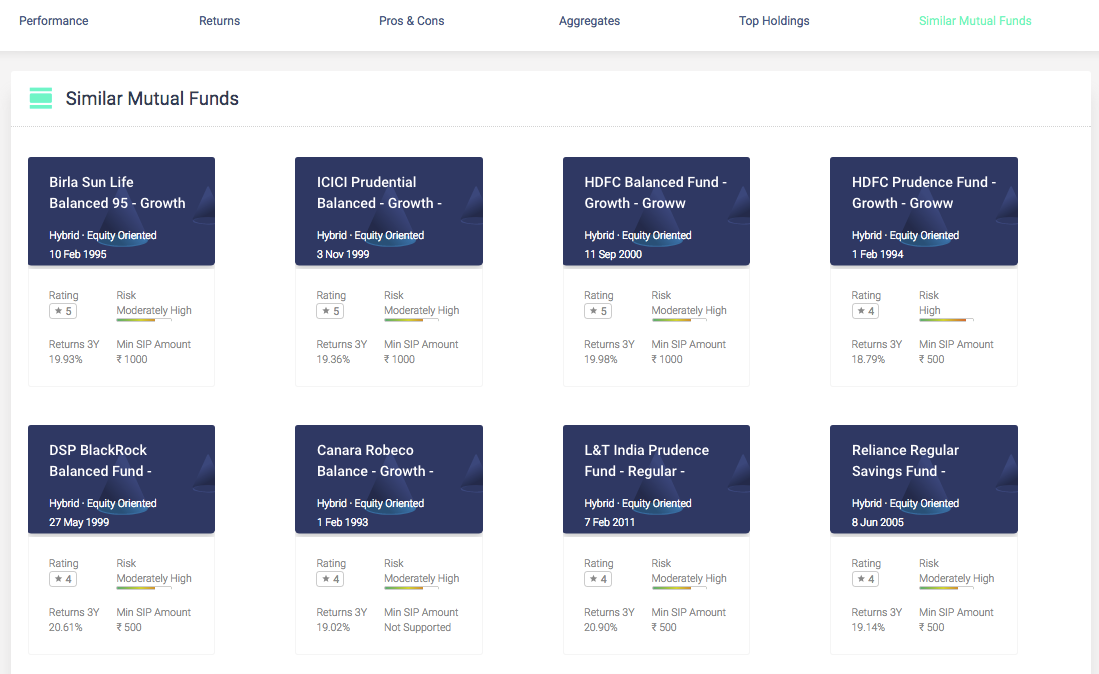
Similar Mutual Funds
We also provide funds similar to this fund sorted based on their rating for you to explore more funds.
Hope this helps.
Happy Investing!